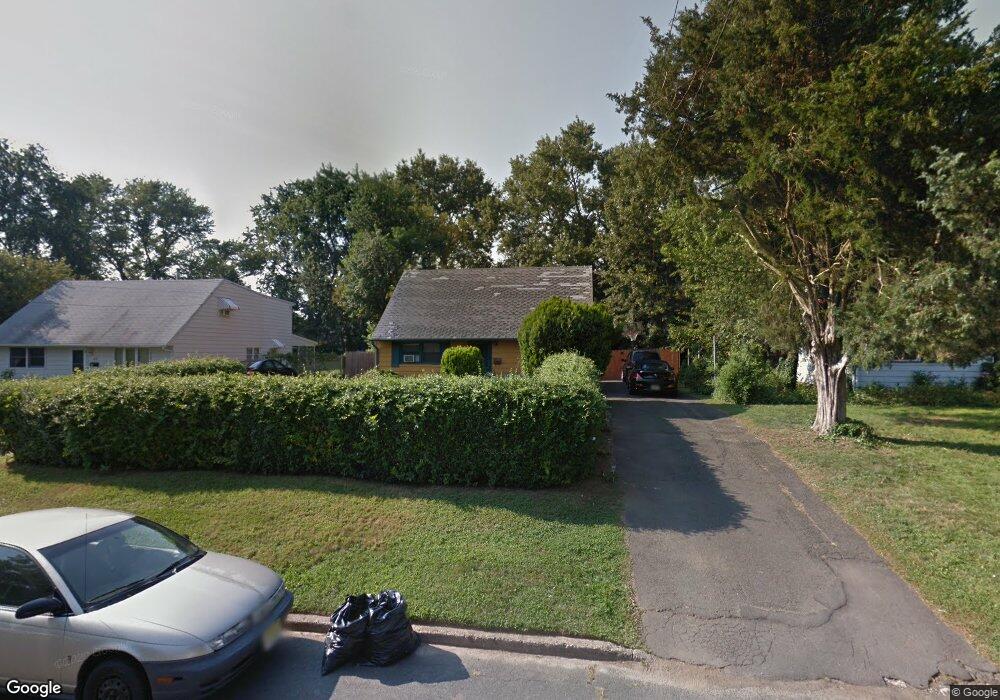
47 Farrell Ave Ewing, NJ 08618
Parkway Village NeighborhoodEstimated Value: $262,000 - $336,000
4
Beds
1
Bath
1,041
Sq Ft
$297/Sq Ft
Est. Value
About This Home
This home is located at 47 Farrell Ave, Ewing, NJ 08618 and is currently estimated at $309,262, approximately $297 per square foot. 47 Farrell Ave is a home located in Mercer County with nearby schools including Ewing High School and Trenton Stem-To-Civics Charter School.
Ownership History
Date
Name
Owned For
Owner Type
Purchase Details
Closed on
Dec 21, 2016
Sold by
Rosco Holdings Llc
Bought by
Dw Ventures Llc
Current Estimated Value
Home Financials for this Owner
Home Financials are based on the most recent Mortgage that was taken out on this home.
Original Mortgage
$150,000
Outstanding Balance
$122,666
Interest Rate
3.94%
Mortgage Type
Commercial
Estimated Equity
$186,596
Purchase Details
Closed on
Jun 23, 2016
Sold by
Secretatry Of Veterans Affairs
Bought by
Rosco Holdings Limited Liability Company
Purchase Details
Closed on
Sep 25, 2015
Sold by
Lovette Chrico D
Bought by
Secretary Of Veterans Affairs
Purchase Details
Closed on
Nov 5, 1996
Sold by
Walsh Maryanne
Bought by
Winnick Stanley
Home Financials for this Owner
Home Financials are based on the most recent Mortgage that was taken out on this home.
Original Mortgage
$36,000
Interest Rate
7.82%
Create a Home Valuation Report for This Property
The Home Valuation Report is an in-depth analysis detailing your home's value as well as a comparison with similar homes in the area
Home Values in the Area
Average Home Value in this Area
Purchase History
| Date | Buyer | Sale Price | Title Company |
|---|---|---|---|
| Dw Ventures Llc | $150,000 | None Available | |
| Rosco Holdings Limited Liability Company | $47,000 | None Available | |
| Secretary Of Veterans Affairs | -- | Liberty Bell Agency Inc | |
| Winnick Stanley | $45,000 | -- |
Source: Public Records
Mortgage History
| Date | Status | Borrower | Loan Amount |
|---|---|---|---|
| Open | Dw Ventures Llc | $150,000 | |
| Previous Owner | Winnick Stanley | $36,000 |
Source: Public Records
Tax History
| Year | Tax Paid | Tax Assessment Tax Assessment Total Assessment is a certain percentage of the fair market value that is determined by local assessors to be the total taxable value of land and additions on the property. | Land | Improvement |
|---|---|---|---|---|
| 2025 | $5,805 | $147,600 | $53,200 | $94,400 |
| 2024 | $5,457 | $147,600 | $53,200 | $94,400 |
Source: Public Records
Map
Nearby Homes
- 991 Terrace Blvd
- 126 Rutledge Ave
- 33 Stratford Ave
- 24 Glen Stewart Dr
- 1060 Terrace Blvd
- 37 Central Ave
- 20 Steinway Ave
- 768 Parkway Ave
- 9 Weston Rd
- 41 Harding St
- 161 Louisiana Ave
- 21 Dixmont Ave
- 16 Ranchwood Dr
- 643 Concord Cir
- 120 Sussex St
- 71 Carlton Ave
- 28 Brattle Ave
- 525 Cleardale Ave
- 50 Groveland Ave
- 140 Crescent Ave
Your Personal Tour Guide
Ask me questions while you tour the home.