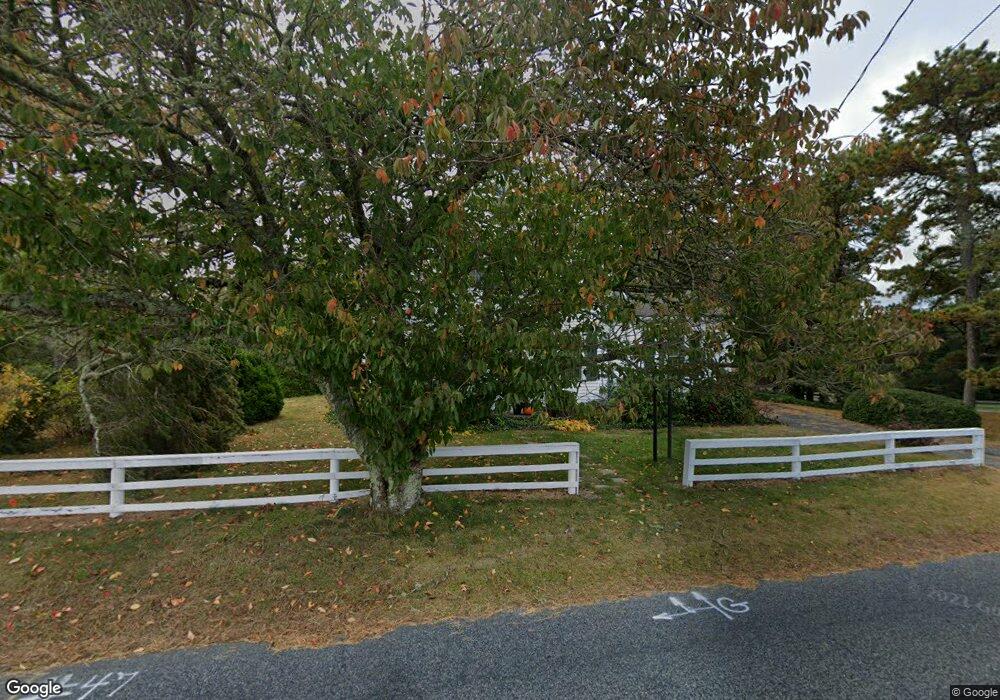
47 Fisk St West Dennis, MA 02670
West Dennis NeighborhoodEstimated Value: $789,055 - $1,067,000
3
Beds
2
Baths
2,200
Sq Ft
$424/Sq Ft
Est. Value
About This Home
This home is located at 47 Fisk St, West Dennis, MA 02670 and is currently estimated at $932,014, approximately $423 per square foot. 47 Fisk St is a home located in Barnstable County with nearby schools including Dennis-Yarmouth Regional High School and St. Pius X. School.
Ownership History
Date
Name
Owned For
Owner Type
Purchase Details
Closed on
Feb 16, 2022
Sold by
Dudac James M and Dudac Belva B
Bought by
James Michael Dudac Lt and Dudac
Current Estimated Value
Purchase Details
Closed on
Mar 15, 2006
Sold by
Knox Matthew Scott
Bought by
Dudac Belva B and Dudac James M
Home Financials for this Owner
Home Financials are based on the most recent Mortgage that was taken out on this home.
Original Mortgage
$450,000
Interest Rate
6.27%
Mortgage Type
Purchase Money Mortgage
Create a Home Valuation Report for This Property
The Home Valuation Report is an in-depth analysis detailing your home's value as well as a comparison with similar homes in the area
Home Values in the Area
Average Home Value in this Area
Purchase History
| Date | Buyer | Sale Price | Title Company |
|---|---|---|---|
| James Michael Dudac Lt | -- | None Available | |
| James Michael Dudac Lt | -- | None Available | |
| Dudac Belva B | $601,000 | -- | |
| Knox Matthew Scott | -- | -- | |
| Knox Matthew Scott | -- | -- |
Source: Public Records
Mortgage History
| Date | Status | Borrower | Loan Amount |
|---|---|---|---|
| Previous Owner | Knox Matthew Scott | $450,000 | |
| Previous Owner | Knox Matthew Scott | $170,000 |
Source: Public Records
Tax History Compared to Growth
Tax History
| Year | Tax Paid | Tax Assessment Tax Assessment Total Assessment is a certain percentage of the fair market value that is determined by local assessors to be the total taxable value of land and additions on the property. | Land | Improvement |
|---|---|---|---|---|
| 2025 | $3,025 | $698,500 | $212,200 | $486,300 |
| 2024 | $2,932 | $667,900 | $204,000 | $463,900 |
| 2023 | $2,836 | $607,300 | $185,500 | $421,800 |
| 2022 | $2,779 | $496,200 | $183,800 | $312,400 |
| 2021 | $2,926 | $485,200 | $180,200 | $305,000 |
| 2020 | $3,040 | $498,400 | $196,600 | $301,800 |
| 2019 | $2,905 | $470,900 | $160,600 | $310,300 |
| 2018 | $3,168 | $499,700 | $229,300 | $270,400 |
| 2017 | $2,849 | $463,300 | $183,500 | $279,800 |
| 2016 | $2,916 | $446,500 | $206,400 | $240,100 |
| 2015 | $2,858 | $446,500 | $206,400 | $240,100 |
| 2014 | $2,887 | $454,600 | $206,400 | $248,200 |
Source: Public Records
Map
Nearby Homes
- 14 Schoolhouse Ln
- 209 Main St Unit 5
- 209 Main St Unit 6
- 209 Main St Unit 4
- 209 Main St Unit 3
- 209 Main St Unit 2
- 209 Main St Unit 1
- 23 Doric Ave
- 141 Main St Unit 4
- 141 Main St Unit 23
- 178 School St
- 401 Main St Unit 201
- 401 Main St Unit 101
- 22 Beach View Rd
- 24 Regan Rd
- 45 Seth Ln
- 308 Old Main St
- 29 Bass River Rd
- 61 Trotters Ln
- 18 Turner Ln