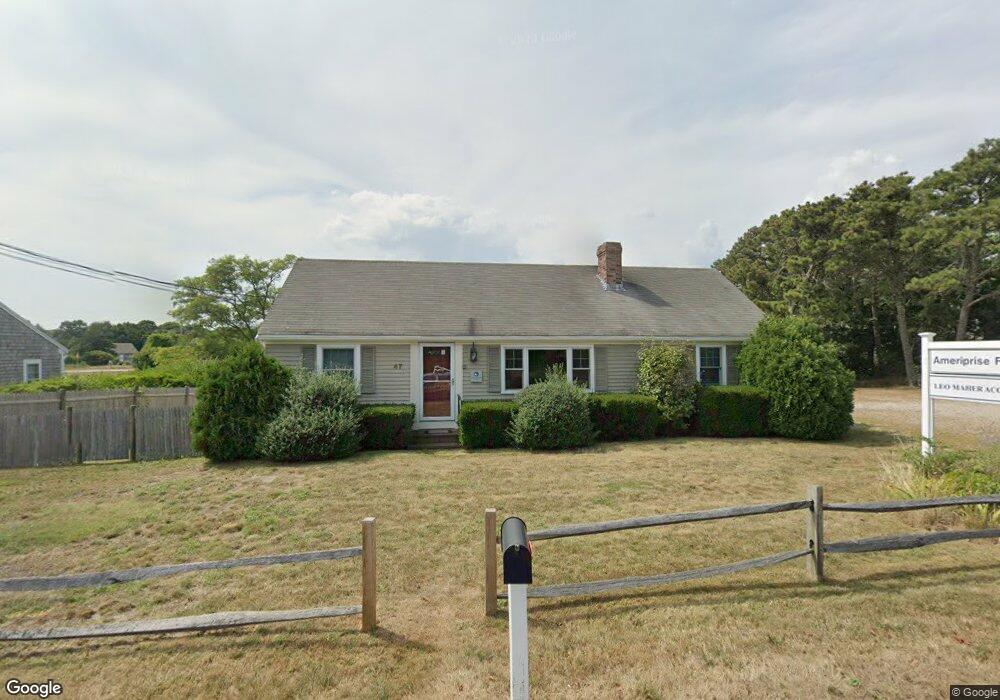
47 George Ryder Rd Unit Rear Chatham, MA 02633
West Chatham NeighborhoodEstimated Value: $808,270
2
Beds
2
Baths
360
Sq Ft
$2,245/Sq Ft
Est. Value
About This Home
This home is located at 47 George Ryder Rd Unit Rear, Chatham, MA 02633 and is currently estimated at $808,270, approximately $2,245 per square foot. 47 George Ryder Rd Unit Rear is a home located in Barnstable County with nearby schools including Chatham Elementary School, Harwich Elementary School, and Monomoy Regional Middle School.
Ownership History
Date
Name
Owned For
Owner Type
Purchase Details
Closed on
Jun 19, 2017
Sold by
Ensign 53 Llc
Bought by
North Beach Properties
Current Estimated Value
Home Financials for this Owner
Home Financials are based on the most recent Mortgage that was taken out on this home.
Original Mortgage
$300,000
Outstanding Balance
$249,537
Interest Rate
4.02%
Mortgage Type
Commercial
Estimated Equity
$558,733
Purchase Details
Closed on
Sep 27, 2002
Sold by
Siam Nt
Bought by
Ensign 53 Llc
Purchase Details
Closed on
Oct 4, 1989
Sold by
Oppenheim David I
Bought by
Siam Nt
Home Financials for this Owner
Home Financials are based on the most recent Mortgage that was taken out on this home.
Original Mortgage
$180,000
Interest Rate
10.12%
Mortgage Type
Commercial
Create a Home Valuation Report for This Property
The Home Valuation Report is an in-depth analysis detailing your home's value as well as a comparison with similar homes in the area
Home Values in the Area
Average Home Value in this Area
Purchase History
| Date | Buyer | Sale Price | Title Company |
|---|---|---|---|
| North Beach Properties | $370,000 | -- | |
| Ensign 53 Llc | $287,000 | -- | |
| Siam Nt | $218,000 | -- |
Source: Public Records
Mortgage History
| Date | Status | Borrower | Loan Amount |
|---|---|---|---|
| Open | North Beach Properties | $300,000 | |
| Previous Owner | Siam Nt | $161,250 | |
| Previous Owner | Siam Nt | $180,000 |
Source: Public Records
Tax History Compared to Growth
Tax History
| Year | Tax Paid | Tax Assessment Tax Assessment Total Assessment is a certain percentage of the fair market value that is determined by local assessors to be the total taxable value of land and additions on the property. | Land | Improvement |
|---|---|---|---|---|
| 2025 | $1,894 | $545,700 | $289,500 | $256,200 |
| 2024 | $1,874 | $524,900 | $278,300 | $246,600 |
| 2023 | $1,856 | $478,300 | $253,000 | $225,300 |
| 2022 | $1,994 | $431,600 | $230,100 | $201,500 |
| 2021 | $2,122 | $426,200 | $228,900 | $197,300 |
| 2020 | $2,006 | $416,100 | $228,900 | $187,200 |
| 2019 | $2,030 | $418,600 | $228,900 | $189,700 |
| 2018 | $1,927 | $395,700 | $192,200 | $203,500 |
| 2017 | $1,943 | $386,200 | $186,100 | $200,100 |
| 2016 | $1,901 | $378,700 | $182,500 | $196,200 |
| 2015 | $1,829 | $366,600 | $177,200 | $189,400 |
| 2014 | $1,849 | $363,900 | $177,200 | $186,700 |
Source: Public Records
Map
Nearby Homes
- 0 George Ryder Rd Unit 73104629
- 0 George Ryder Rd Unit 22301591
- 1761 Main St
- 6 Stephen Dr
- 40 Youngs Farm Ln
- 19 Captain Richards Way Unit 1
- 38 Indian Trail
- 30 Indian Trail
- 114 Bucks Creek Rd
- 93 Bucks Creek Rd
- 14 Pond View Ln
- 200 Hardings Beach Rd
- 291 Ridgevale Rd
- 0 Evergreen Ln
- 14 Squanto Dr
- 44 Buena Vista Rd
- 70 Lantern Ln
- 13 Captain Knowles Way
- 47 Cranberry Way
- 47 George Ryder Rd
- 47 George Ryder Rd
- 0 George Ryder Rd Unit 72106289
- 0 George Ryder Rd Unit 20601697
- 0 George Ryder Rd Unit 20503772
- 0 George Ryder Rd Unit 2039129
- 0 George Ryder Rd Unit 2013398
- 0 George Ryder Rd Unit 2006376
- 0 George Ryder Rd Unit 21307879
- 0 George Ryder Rd Unit 21610329
- 1716 Main St
- 39 George Ryder Rd
- 52 George Ryder Rd
- 63 George Ryder Rd
- 240 George Ryder Rd
- 55 George Ryder Rd
- 73 George Ryder Rd
- 1698 Main St
- 1674 Main St
- 51 George Ryder Rd