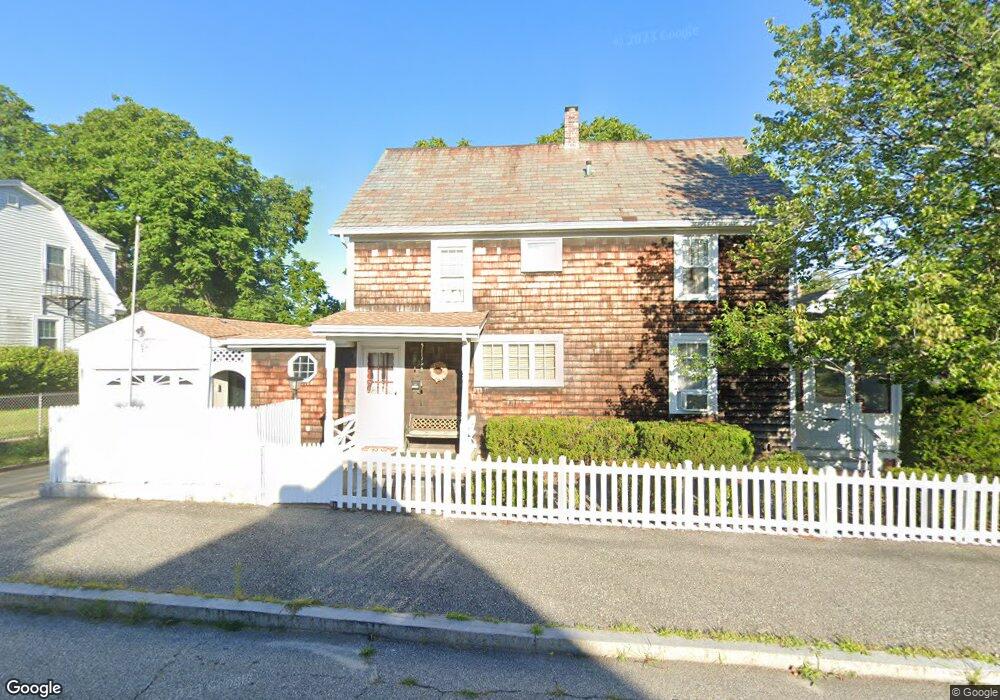
47 Gilbert St Woonsocket, RI 02895
Bernon District NeighborhoodEstimated Value: $374,000 - $386,000
4
Beds
3
Baths
1,494
Sq Ft
$254/Sq Ft
Est. Value
About This Home
This home is located at 47 Gilbert St, Woonsocket, RI 02895 and is currently estimated at $378,947, approximately $253 per square foot. 47 Gilbert St is a home located in Providence County with nearby schools including Woonsocket High School, Founders Academy, and Beacon Charter School.
Ownership History
Date
Name
Owned For
Owner Type
Purchase Details
Closed on
Oct 20, 2020
Sold by
Morse Paul D
Bought by
Morse Paul D and Morse Benjamin
Current Estimated Value
Home Financials for this Owner
Home Financials are based on the most recent Mortgage that was taken out on this home.
Original Mortgage
$143,500
Outstanding Balance
$126,476
Interest Rate
2.9%
Mortgage Type
New Conventional
Estimated Equity
$252,471
Purchase Details
Closed on
Jul 25, 2005
Sold by
Bibeault Lucien R
Bought by
Morse Paul D
Home Financials for this Owner
Home Financials are based on the most recent Mortgage that was taken out on this home.
Original Mortgage
$140,000
Interest Rate
5.59%
Mortgage Type
Purchase Money Mortgage
Create a Home Valuation Report for This Property
The Home Valuation Report is an in-depth analysis detailing your home's value as well as a comparison with similar homes in the area
Home Values in the Area
Average Home Value in this Area
Purchase History
| Date | Buyer | Sale Price | Title Company |
|---|---|---|---|
| Morse Paul D | -- | None Available | |
| Morse Paul D | -- | None Available | |
| Morse Paul D | -- | None Available | |
| Morse Paul D | $240,000 | -- | |
| Morse Paul D | $240,000 | -- |
Source: Public Records
Mortgage History
| Date | Status | Borrower | Loan Amount |
|---|---|---|---|
| Open | Morse Paul D | $143,500 | |
| Closed | Morse Paul D | $143,500 | |
| Previous Owner | Morse Paul D | $121,300 | |
| Previous Owner | Morse Paul D | $25,000 | |
| Previous Owner | Morse Paul D | $140,000 |
Source: Public Records
Tax History
| Year | Tax Paid | Tax Assessment Tax Assessment Total Assessment is a certain percentage of the fair market value that is determined by local assessors to be the total taxable value of land and additions on the property. | Land | Improvement |
|---|---|---|---|---|
| 2025 | $3,944 | $351,200 | $102,100 | $249,100 |
| 2024 | $3,844 | $264,400 | $90,600 | $173,800 |
| 2023 | $3,696 | $264,400 | $90,600 | $173,800 |
| 2022 | $3,696 | $264,400 | $90,600 | $173,800 |
| 2021 | $4,035 | $169,900 | $55,200 | $114,700 |
| 2020 | $4,078 | $169,900 | $55,200 | $114,700 |
| 2018 | $4,091 | $169,900 | $55,200 | $114,700 |
| 2017 | $4,042 | $134,300 | $44,500 | $89,800 |
| 2016 | $4,276 | $134,300 | $44,500 | $89,800 |
| 2015 | $4,913 | $134,300 | $44,500 | $89,800 |
| 2014 | $4,669 | $129,900 | $49,000 | $80,900 |
Source: Public Records
Map
Nearby Homes
- 87 Kermit St
- 1 Admiral St
- 147 Warwick St
- 59 Cooper Ave
- 122 Grand St
- 0 Irving Lot 192 Ave Unit 1383138
- 109 Hemond Ave
- 15 Knight St
- 604 Providence St
- 0 Caron Ave Unit 1379503
- 0 Caron Ave Unit 73342710
- 0 Laflamme Ave
- 0 Irving Lot 206 Ave Unit 1397321
- 43 Summit St
- 219 Crawford St
- 184 Avenue C Unit 2
- 184 Avenue C Unit 5
- 184 Avenue C Unit 6
- 184 Avenue C Unit 3
- 184 Avenue C Unit 4
Your Personal Tour Guide
Ask me questions while you tour the home.