47 Gilson Rd Scituate, MA 02066
Estimated Value: $1,096,846 - $1,316,000
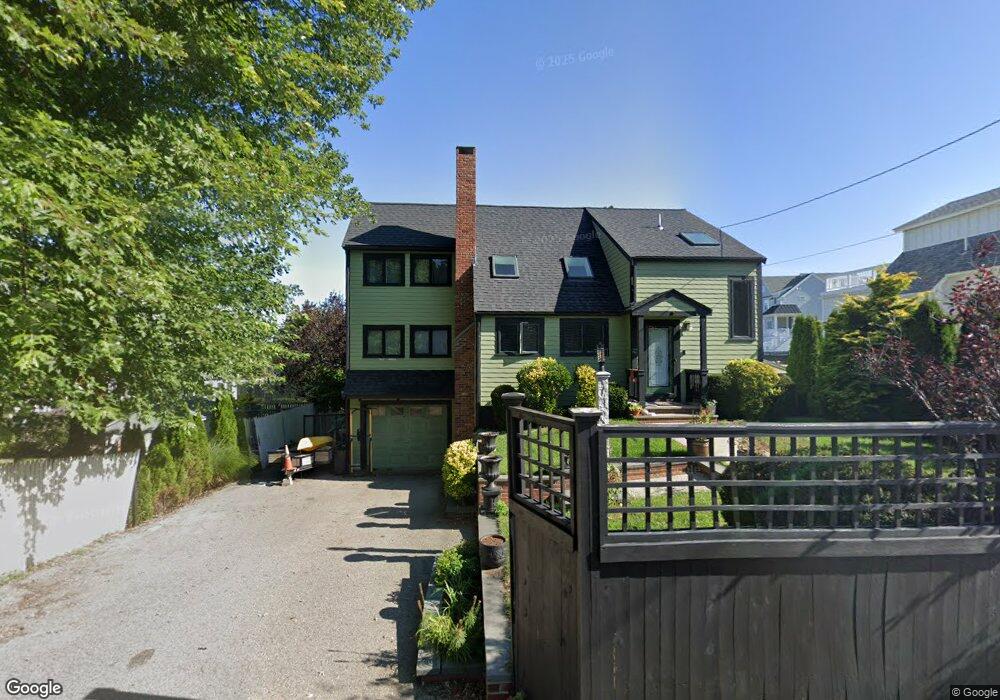
About This Home
This home is located at 47 Gilson Rd, Scituate, MA 02066 and is currently estimated at $1,178,212, approximately $632 per square foot. 47 Gilson Rd is a home located in Plymouth County with nearby schools including Jenkins Elementary School, Lester J. Gates Middle School, and Scituate High School.
Ownership History
We collect this data history from publicly available records. To have your information removed, we recommend requesting removal directly through your county’s website.
Purchase Details
Purchase Details
Home Values in the Area
Average Home Value in this Area
Purchase History
We collect this data history from publicly available records. To have your information removed, we recommend requesting removal directly through your county’s website.
| Date | Buyer | Sale Price | Title Company |
|---|---|---|---|
| $112,500 | -- | ||
| $124,601 | -- |
Mortgage History
We collect this data history from publicly available records. To have your information removed, we recommend requesting removal directly through your county’s website.
| Date | Status | Borrower | Loan Amount |
|---|---|---|---|
| Closed | $400,000 | ||
| Closed | $133,892 | ||
| Closed | $140,000 |
Tax History
We collect this data history from publicly available records. To have your information removed, we recommend requesting removal directly through your county’s website.
| Year | Tax Paid | Tax Assessment Tax Assessment Total Assessment is a certain percentage of the fair market value that is determined by local assessors to be the total taxable value of land and additions on the property. | Land | Improvement |
|---|---|---|---|---|
| 2025 | $9,075 | $908,400 | $486,100 | $422,300 |
| 2024 | $9,404 | $907,700 | $459,600 | $448,100 |
| 2023 | $8,626 | $821,800 | $417,800 | $404,000 |
| 2022 | $8,626 | $683,500 | $344,600 | $338,900 |
| 2021 | $6,182 | $615,800 | $328,200 | $287,600 |
| 2020 | $6,052 | $593,200 | $315,500 | $277,700 |
| 2019 | $5,771 | $571,500 | $309,300 | $262,200 |
| 2018 | $5,662 | $548,400 | $303,700 | $244,700 |
| 2017 | $7,442 | $528,200 | $283,500 | $244,700 |
| 2016 | $7,469 | $528,200 | $283,500 | $244,700 |
| 2015 | $6,653 | $507,900 | $263,200 | $244,700 |
Map
- 119 Gilson Rd
- 59 Greenfield Ln
- 41 First Parish Rd
- 79 Collier Rd
- 58 Brook St
- 22 Sandy Hill Cir Unit 22
- 15 Hazel Ave
- 200 Stockbridge Rd
- 2 Rachels Way Unit 2
- 66 Station St
- 156 First Parish Rd Unit 6
- 6 Brookside Ln
- 11 Brookline Rd
- 32 Barker Rd Unit 3
- 5 Otis Rd
- 6 Spaulding Ave
- 26 Neal Gate St
- 153 Jericho Rd Unit 2
- 1 Trouants Island
- 24 Merritt Ln
Ask me questions while you tour the home.