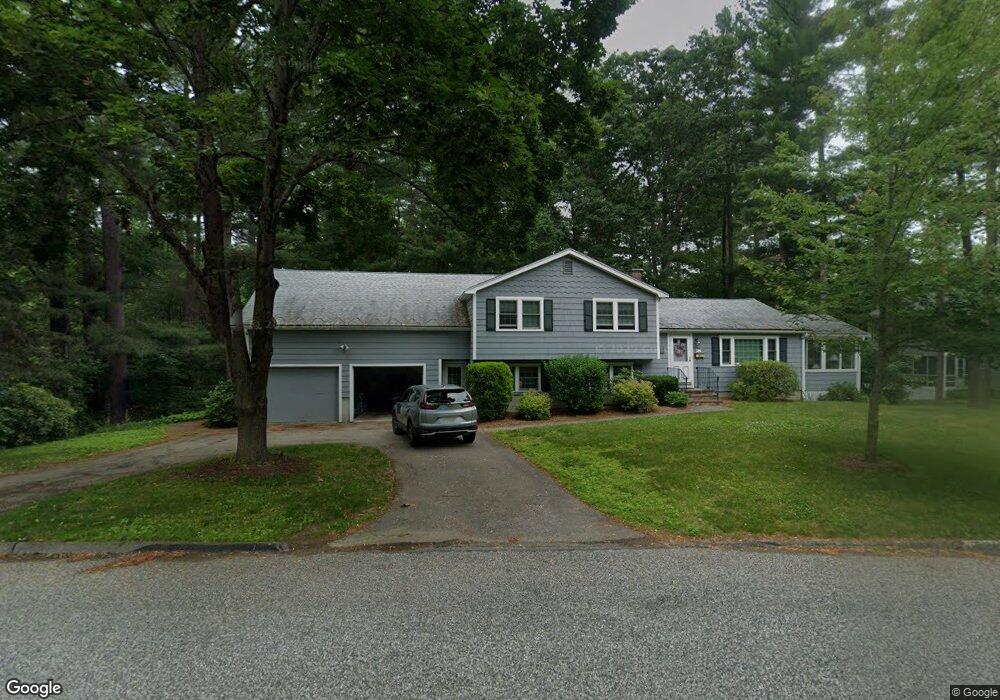
47 Ginley Rd Walpole, MA 02081
Estimated Value: $713,042 - $952,000
3
Beds
2
Baths
1,691
Sq Ft
$486/Sq Ft
Est. Value
About This Home
This home is located at 47 Ginley Rd, Walpole, MA 02081 and is currently estimated at $821,511, approximately $485 per square foot. 47 Ginley Rd is a home located in Norfolk County with nearby schools including Fisher School, Walpole Middle School, and Walpole High School.
Ownership History
Date
Name
Owned For
Owner Type
Purchase Details
Closed on
Oct 9, 2024
Sold by
Riegel Dennis W and Hamilton Judith A
Bought by
Riegel-Hamilton Ft and Riegel
Current Estimated Value
Purchase Details
Closed on
Aug 1, 1990
Sold by
Shafto Dennis P
Bought by
Riegel Dennis W
Create a Home Valuation Report for This Property
The Home Valuation Report is an in-depth analysis detailing your home's value as well as a comparison with similar homes in the area
Home Values in the Area
Average Home Value in this Area
Purchase History
| Date | Buyer | Sale Price | Title Company |
|---|---|---|---|
| Riegel-Hamilton Ft | -- | None Available | |
| Riegel-Hamilton Ft | -- | None Available | |
| Riegel Dennis W | $212,500 | -- | |
| Riegel Dennis W | $212,500 | -- |
Source: Public Records
Mortgage History
| Date | Status | Borrower | Loan Amount |
|---|---|---|---|
| Previous Owner | Riegel Dennis W | $250,000 | |
| Previous Owner | Riegel Dennis W | $206,000 | |
| Previous Owner | Riegel Dennis W | $170,000 |
Source: Public Records
Tax History
| Year | Tax Paid | Tax Assessment Tax Assessment Total Assessment is a certain percentage of the fair market value that is determined by local assessors to be the total taxable value of land and additions on the property. | Land | Improvement |
|---|---|---|---|---|
| 2025 | $9,286 | $723,800 | $369,000 | $354,800 |
| 2024 | $8,961 | $677,800 | $354,800 | $323,000 |
| 2023 | $8,566 | $616,700 | $308,500 | $308,200 |
| 2022 | $8,096 | $559,900 | $285,800 | $274,100 |
| 2021 | $7,785 | $524,600 | $269,500 | $255,100 |
| 2020 | $7,577 | $505,500 | $254,300 | $251,200 |
| 2019 | $7,330 | $485,400 | $244,500 | $240,900 |
| 2018 | $7,137 | $467,400 | $236,000 | $231,400 |
| 2017 | $6,902 | $450,200 | $227,000 | $223,200 |
| 2016 | $6,713 | $431,400 | $218,300 | $213,100 |
| 2015 | $6,357 | $404,900 | $199,700 | $205,200 |
| 2014 | $6,033 | $382,800 | $199,700 | $183,100 |
Source: Public Records
Map
Nearby Homes
- 90 Walnut St
- 7 Haynes St
- 19 and 23 Arlington Ln
- 108 Kendall St
- 881 Main St Unit 5
- 2301 Pennington Dr Unit 2301
- 1108 Pennington Dr Unit 1108
- 7 Lilac Ct
- 16 York Cir
- 65-67 Diamond St
- 41-43 Stone St
- 269 Bullard St
- 19 Rainbow Pond Dr Unit B2
- 16 Foxhunt Trail
- 28 Lancelot Ct
- 527 Walpole St
- 10 Country Club Dr
- 120 Spring St
- 29 Clapp St
- 6 Teal Cir
Your Personal Tour Guide
Ask me questions while you tour the home.