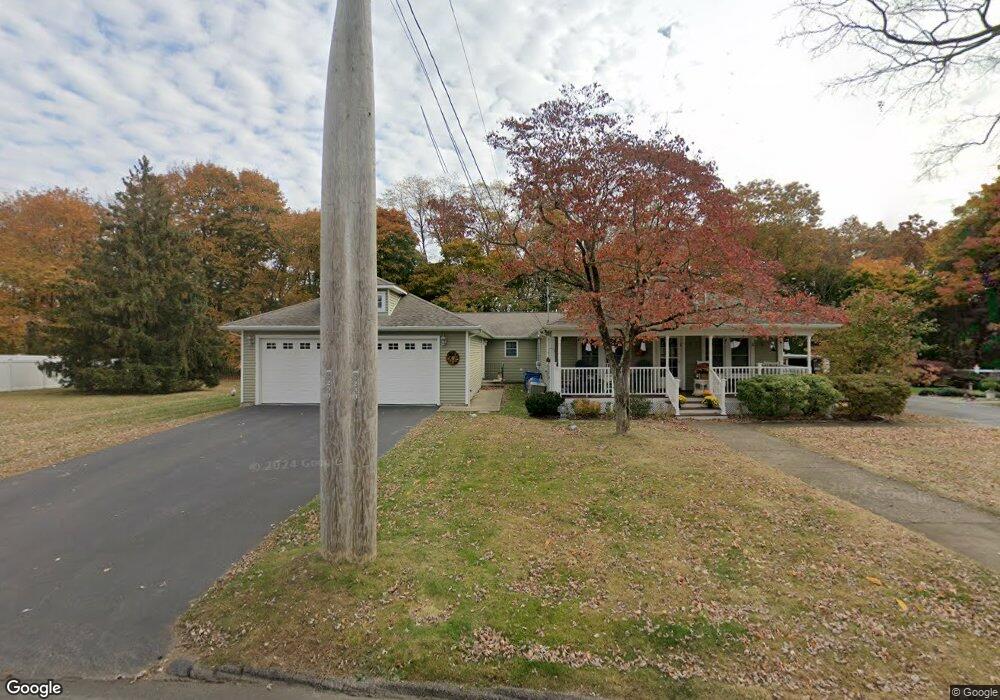
47 Grant Ct Norwich, CT 06360
Central Norwich NeighborhoodEstimated Value: $287,000 - $389,000
4
Beds
3
Baths
2,652
Sq Ft
$132/Sq Ft
Est. Value
About This Home
This home is located at 47 Grant Ct, Norwich, CT 06360 and is currently estimated at $348,761, approximately $131 per square foot. 47 Grant Ct is a home located in New London County with nearby schools including John B. Stanton Elementary School, Teachers' Memorial Global Studies Magnet Middle, and Montessori Discovery School.
Ownership History
Date
Name
Owned For
Owner Type
Purchase Details
Closed on
Jul 14, 1999
Sold by
Brown Elizabeth J
Bought by
Goupille Giselle S
Current Estimated Value
Home Financials for this Owner
Home Financials are based on the most recent Mortgage that was taken out on this home.
Original Mortgage
$80,000
Interest Rate
7.5%
Mortgage Type
Purchase Money Mortgage
Create a Home Valuation Report for This Property
The Home Valuation Report is an in-depth analysis detailing your home's value as well as a comparison with similar homes in the area
Home Values in the Area
Average Home Value in this Area
Purchase History
| Date | Buyer | Sale Price | Title Company |
|---|---|---|---|
| Goupille Giselle S | $89,000 | -- | |
| Goupille Giselle S | $89,000 | -- |
Source: Public Records
Mortgage History
| Date | Status | Borrower | Loan Amount |
|---|---|---|---|
| Open | Goupille Giselle S | $92,850 | |
| Closed | Goupille Giselle S | $96,000 | |
| Closed | Goupille Giselle S | $80,000 |
Source: Public Records
Tax History
| Year | Tax Paid | Tax Assessment Tax Assessment Total Assessment is a certain percentage of the fair market value that is determined by local assessors to be the total taxable value of land and additions on the property. | Land | Improvement |
|---|---|---|---|---|
| 2025 | $10,882 | $268,900 | $55,200 | $213,700 |
| 2024 | $10,272 | $268,900 | $55,200 | $213,700 |
| 2023 | $8,040 | $165,300 | $32,000 | $133,300 |
| 2022 | $8,014 | $165,300 | $32,000 | $133,300 |
| 2021 | $0 | $165,300 | $32,000 | $133,300 |
| 2020 | $0 | $165,200 | $31,900 | $133,300 |
| 2019 | $7,928 | $165,200 | $31,900 | $133,300 |
| 2018 | $6,552 | $135,400 | $27,400 | $108,000 |
| 2017 | $6,599 | $135,400 | $27,400 | $108,000 |
| 2016 | $6,643 | $135,400 | $27,400 | $108,000 |
| 2015 | $6,507 | $135,400 | $27,400 | $108,000 |
| 2014 | $6,219 | $135,400 | $27,400 | $108,000 |
Source: Public Records
Map
Nearby Homes
- 40 Maple Grove Ave
- 83 Maple St
- 14 Sturtevant Ave
- 2 East Ave
- 125 Maple St
- 76 Alice Street Extension
- 127 Maple St
- 41 Peck St
- 7 Swan Ave
- 21 Buckingham Ave
- 34 Buckingham Ave
- 150 Yantic St Unit 224
- 9 Washington St
- 104 Mount Pleasant St
- 459 W Main St
- 10 Rockwell St
- 28 Perkins Ave
- 185 Broadway
- 18 Pine St
- 510 W Main St
Your Personal Tour Guide
Ask me questions while you tour the home.