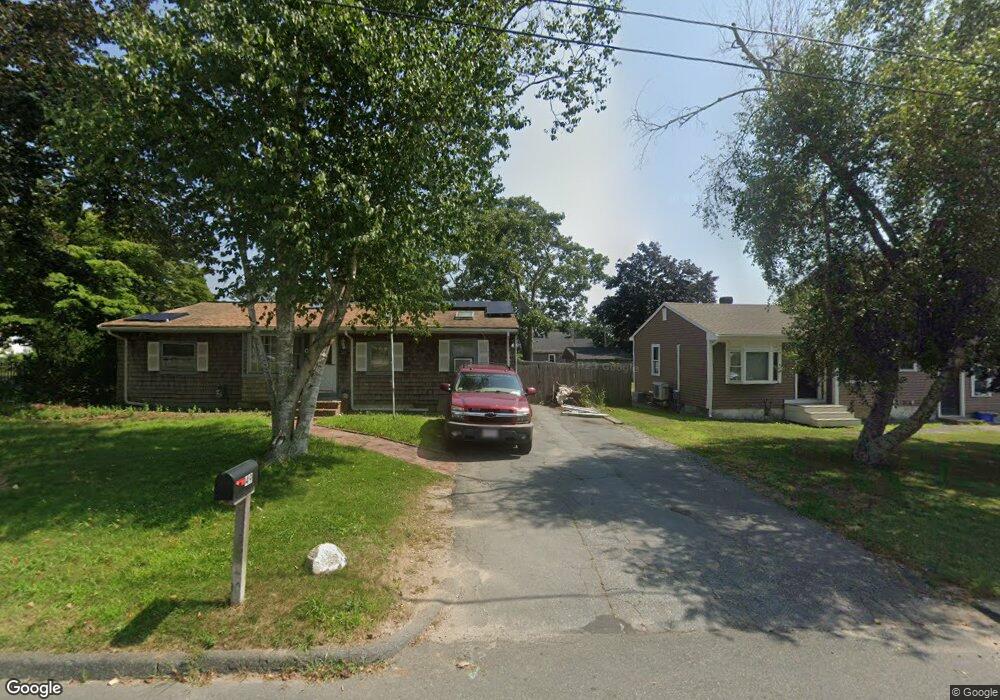
47 Hacker St Fairhaven, MA 02719
Pope Beach NeighborhoodEstimated Value: $469,000 - $548,973
4
Beds
2
Baths
1,336
Sq Ft
$385/Sq Ft
Est. Value
About This Home
This home is located at 47 Hacker St, Fairhaven, MA 02719 and is currently estimated at $513,993, approximately $384 per square foot. 47 Hacker St is a home located in Bristol County with nearby schools including Fairhaven High School, City On A Hill Charter Public School New Bedford, and St. Joseph School.
Ownership History
Date
Name
Owned For
Owner Type
Purchase Details
Closed on
Jan 10, 2014
Sold by
Dexter Michael P and Devlin-Dexter Christine
Bought by
Dexter Michael P
Current Estimated Value
Purchase Details
Closed on
Aug 11, 2009
Sold by
Roth Bruce L and Roth Frederick
Bought by
Dexter Michael P and Devlin-Dexter Christine
Home Financials for this Owner
Home Financials are based on the most recent Mortgage that was taken out on this home.
Original Mortgage
$175,200
Interest Rate
5.47%
Mortgage Type
Purchase Money Mortgage
Purchase Details
Closed on
Mar 4, 2008
Sold by
Rothtec Realty Corp
Bought by
Roth Bruce L and Roth Frederick E
Purchase Details
Closed on
Aug 23, 2004
Sold by
Borges Lori A and Borges Timothy W
Bought by
Rothtec Realty Corp
Purchase Details
Closed on
Dec 5, 1996
Sold by
Teixeira Adelino M and Teixeira Sandra
Bought by
Borges Timothy W and Borges Lori A
Create a Home Valuation Report for This Property
The Home Valuation Report is an in-depth analysis detailing your home's value as well as a comparison with similar homes in the area
Home Values in the Area
Average Home Value in this Area
Purchase History
| Date | Buyer | Sale Price | Title Company |
|---|---|---|---|
| Dexter Michael P | -- | -- | |
| Dexter Michael P | $219,000 | -- | |
| Roth Bruce L | -- | -- | |
| Rothtec Realty Corp | $295,000 | -- | |
| Borges Timothy W | $140,000 | -- |
Source: Public Records
Mortgage History
| Date | Status | Borrower | Loan Amount |
|---|---|---|---|
| Previous Owner | Borges Timothy W | $175,200 | |
| Previous Owner | Borges Timothy W | $25,197 |
Source: Public Records
Tax History
| Year | Tax Paid | Tax Assessment Tax Assessment Total Assessment is a certain percentage of the fair market value that is determined by local assessors to be the total taxable value of land and additions on the property. | Land | Improvement |
|---|---|---|---|---|
| 2025 | $33 | $350,800 | $177,200 | $173,600 |
| 2024 | $3,111 | $337,100 | $177,200 | $159,900 |
| 2023 | $2,964 | $297,900 | $155,200 | $142,700 |
| 2022 | $2,864 | $280,200 | $144,300 | $135,900 |
| 2021 | $2,817 | $249,500 | $130,500 | $119,000 |
| 2020 | $2,701 | $244,200 | $130,500 | $113,700 |
| 2019 | $2,527 | $216,500 | $108,300 | $108,200 |
| 2018 | $2,428 | $206,600 | $103,000 | $103,600 |
| 2017 | $2,444 | $203,000 | $103,000 | $100,000 |
| 2016 | $2,473 | $203,000 | $103,000 | $100,000 |
| 2015 | $2,448 | $201,500 | $103,000 | $98,500 |
Source: Public Records
Map
Nearby Homes
- 58 Bayview Ave
- 15 Bayview Ave
- 1 Harvard St
- 3.5 Golf St
- 190 Sconticut Neck Rd
- 33 Narragansett Blvd
- 181 Washington St
- 2 Washburn Ave
- 11 Lawton St
- 16 Reservation Rd
- 9 Rochambeau St
- 32 Cedar St
- 81 Washington St
- 133 Pleasant St
- 145 Pleasant St
- 77 Adams St
- 32 Green St
- 58 Washington St
- 0 Nulands Neck Unit 73286360
- 17 Middle St