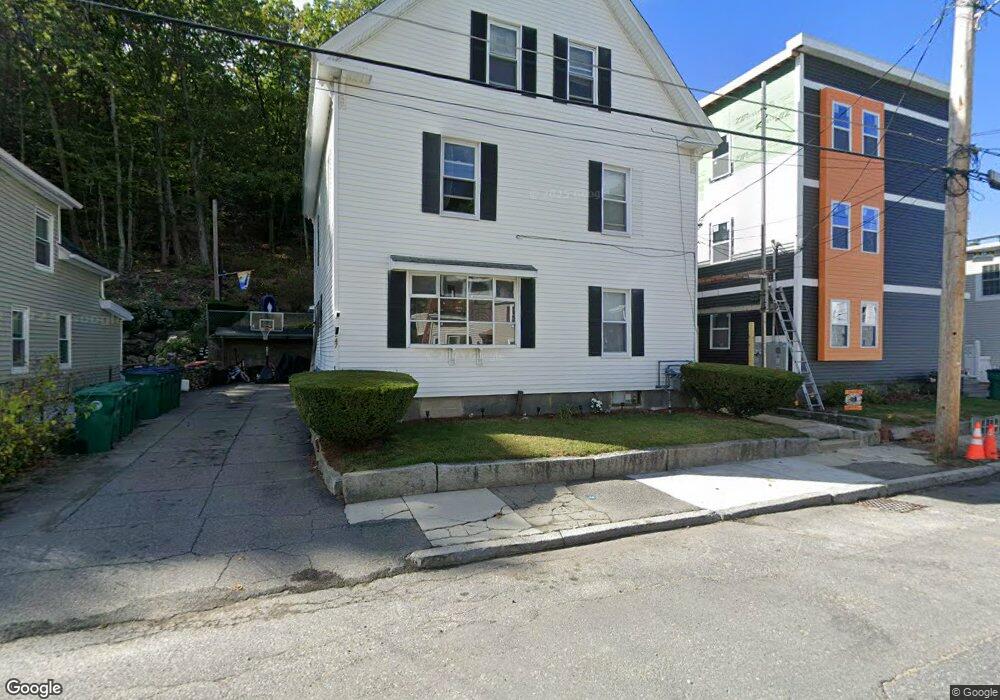
47 Hazel St Unit 49 Fitchburg, MA 01420
Estimated Value: $477,000 - $516,000
5
Beds
3
Baths
2,525
Sq Ft
$195/Sq Ft
Est. Value
About This Home
This home is located at 47 Hazel St Unit 49, Fitchburg, MA 01420 and is currently estimated at $491,667, approximately $194 per square foot. 47 Hazel St Unit 49 is a home located in Worcester County with nearby schools including South Street Elementary School, Crocker Elementary School, and Reingold Elementary School.
Ownership History
Date
Name
Owned For
Owner Type
Purchase Details
Closed on
Nov 3, 2009
Sold by
Ciccone John J
Bought by
Ciccone John J and Ciccone Carole J
Current Estimated Value
Purchase Details
Closed on
Mar 25, 1993
Sold by
St Marys Cu
Bought by
Ciccone John J
Purchase Details
Closed on
Nov 20, 1989
Sold by
Hazel Rt
Bought by
St Marys Cr Un
Purchase Details
Closed on
Mar 25, 1987
Sold by
Boire Robert W
Bought by
Hazel St Rlty Tr
Create a Home Valuation Report for This Property
The Home Valuation Report is an in-depth analysis detailing your home's value as well as a comparison with similar homes in the area
Home Values in the Area
Average Home Value in this Area
Purchase History
| Date | Buyer | Sale Price | Title Company |
|---|---|---|---|
| Ciccone John J | -- | -- | |
| Ciccone John J | $49,000 | -- | |
| St Marys Cr Un | $101,500 | -- | |
| Hazel St Rlty Tr | $127,000 | -- |
Source: Public Records
Mortgage History
| Date | Status | Borrower | Loan Amount |
|---|---|---|---|
| Previous Owner | Hazel St Rlty Tr | $75,000 | |
| Previous Owner | Hazel St Rlty Tr | $50,000 | |
| Previous Owner | Hazel St Rlty Tr | $30,000 |
Source: Public Records
Tax History Compared to Growth
Tax History
| Year | Tax Paid | Tax Assessment Tax Assessment Total Assessment is a certain percentage of the fair market value that is determined by local assessors to be the total taxable value of land and additions on the property. | Land | Improvement |
|---|---|---|---|---|
| 2025 | $55 | $410,500 | $81,700 | $328,800 |
| 2024 | $4,932 | $333,000 | $48,500 | $284,500 |
| 2023 | $4,455 | $278,100 | $37,200 | $240,900 |
| 2022 | $4,184 | $237,600 | $35,000 | $202,600 |
| 2021 | $3,962 | $208,200 | $24,800 | $183,400 |
| 2020 | $3,733 | $189,400 | $20,300 | $169,100 |
| 2019 | $3,012 | $147,000 | $28,200 | $118,800 |
| 2018 | $2,725 | $129,700 | $25,900 | $103,800 |
| 2017 | $2,605 | $121,200 | $23,700 | $97,500 |
| 2016 | $2,607 | $122,800 | $23,700 | $99,100 |
| 2015 | $2,556 | $123,600 | $24,800 | $98,800 |
| 2014 | $2,516 | $126,900 | $24,800 | $102,100 |
Source: Public Records
Map
Nearby Homes