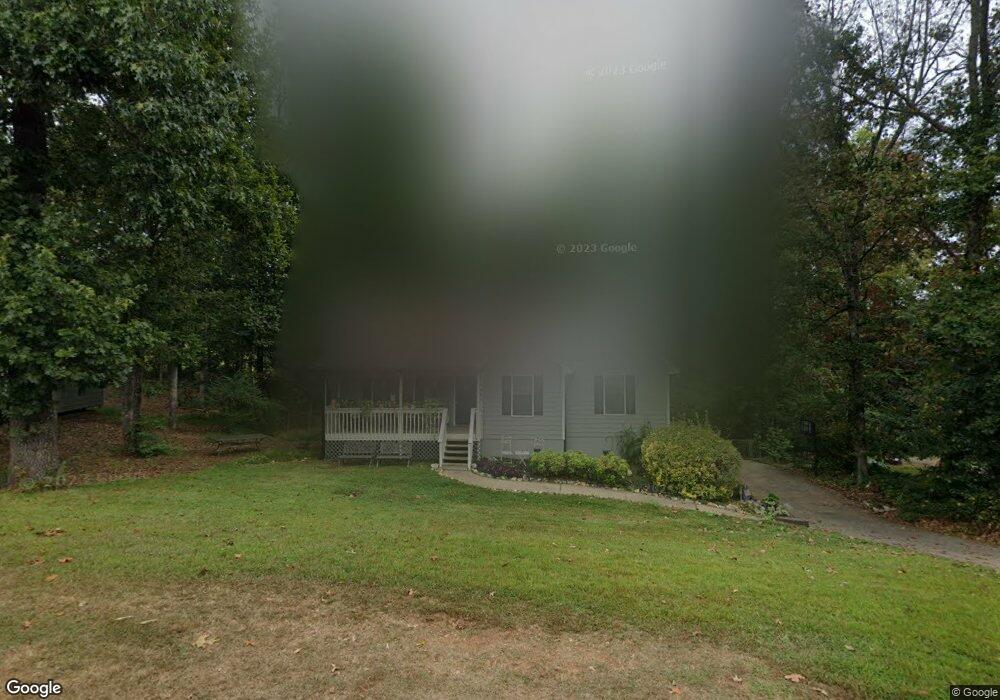
47 Hickory Trail Dallas, GA 30132
Estimated Value: $273,000 - $275,000
4
Beds
2
Baths
1,214
Sq Ft
$226/Sq Ft
Est. Value
About This Home
This home is located at 47 Hickory Trail, Dallas, GA 30132 and is currently estimated at $274,492, approximately $226 per square foot. 47 Hickory Trail is a home located in Paulding County with nearby schools including Burnt Hickory Elementary School, Sammy Mcclure Sr. Middle School, and North Paulding High School.
Ownership History
Date
Name
Owned For
Owner Type
Purchase Details
Closed on
Mar 25, 2011
Sold by
Bowdoin Jeremy N
Bought by
Bowdoin Jeremy N and Bowdoin Heather
Current Estimated Value
Home Financials for this Owner
Home Financials are based on the most recent Mortgage that was taken out on this home.
Original Mortgage
$77,972
Outstanding Balance
$55,330
Interest Rate
5.5%
Mortgage Type
FHA
Estimated Equity
$219,162
Purchase Details
Closed on
Nov 30, 2010
Sold by
Wells Fargo Bk 2005-Wcw1
Bought by
Dwyer Dennis
Purchase Details
Closed on
Dec 1, 2009
Sold by
Hatchitt Curt A
Bought by
Park Place Series 2005-Wcw1
Purchase Details
Closed on
May 24, 2002
Sold by
Laymon David W
Bought by
Hatchitt Curt A
Home Financials for this Owner
Home Financials are based on the most recent Mortgage that was taken out on this home.
Original Mortgage
$111,000
Interest Rate
9.88%
Mortgage Type
New Conventional
Create a Home Valuation Report for This Property
The Home Valuation Report is an in-depth analysis detailing your home's value as well as a comparison with similar homes in the area
Home Values in the Area
Average Home Value in this Area
Purchase History
| Date | Buyer | Sale Price | Title Company |
|---|---|---|---|
| Bowdoin Jeremy N | -- | -- | |
| Dwyer Dennis | $20,000 | -- | |
| Park Place Series 2005-Wcw1 | $100,350 | -- | |
| Hatchitt Curt A | $105,000 | -- |
Source: Public Records
Mortgage History
| Date | Status | Borrower | Loan Amount |
|---|---|---|---|
| Open | Bowdoin Jeremy N | $77,972 | |
| Previous Owner | Hatchitt Curt A | $111,000 |
Source: Public Records
Tax History Compared to Growth
Tax History
| Year | Tax Paid | Tax Assessment Tax Assessment Total Assessment is a certain percentage of the fair market value that is determined by local assessors to be the total taxable value of land and additions on the property. | Land | Improvement |
|---|---|---|---|---|
| 2024 | $2,800 | $112,544 | $12,000 | $100,544 |
| 2023 | $2,448 | $93,908 | $12,000 | $81,908 |
| 2022 | $2,319 | $88,936 | $12,000 | $76,936 |
| 2021 | $1,957 | $67,352 | $10,000 | $57,352 |
| 2020 | $1,788 | $60,208 | $10,000 | $50,208 |
| 2019 | $1,763 | $58,520 | $10,000 | $48,520 |
| 2018 | $1,451 | $48,168 | $8,000 | $40,168 |
| 2017 | $1,422 | $46,556 | $6,000 | $40,556 |
| 2016 | $1,192 | $39,408 | $6,000 | $33,408 |
| 2015 | $1,118 | $36,328 | $6,000 | $30,328 |
| 2014 | $995 | $31,516 | $6,000 | $25,516 |
| 2013 | -- | $15,720 | $6,000 | $9,720 |
Source: Public Records
Map
Nearby Homes
- 477 Williams Rd
- 7 Pioneer Trail
- 154 Windlake Path
- 90 Jones Ridge Way
- TBD Cochran Rd
- 68 Leann Trace
- 98 Wards Creek Ln
- 682 Ferguson Place
- 8418 Cartersville Hwy
- 1235 Williams Rd
- 85 Stiles Dr
- 79 Tori Ln
- 790 Ferguson Place
- 856 Ferguson Place
- 0 Narroway Church Spur
- 2708-A Narroway Church Cir
- 0 Narroway Church Cir Unit 10460252
- 55 Hickory Trail
- 27 Hickory Trail
- 77 Hickory Trail
- 0 Hickory Trail Unit 7143585
- 0 Hickory Trail Unit 7182163
- 0 Hickory Trail Unit 8141563
- 0 Hickory Trail Unit 7588236
- 185 Williams Rd
- 105 Hickory Trail
- 64 Hickory Trail
- 133 Williams Rd
- 80 Hickory Trail
- 152 Williams Rd
- 119 Hickory Trail
- 115 Williams Rd
- 237 Williams Rd
- 106 Hickory Trail
- 21 Blake Ct
- 28 Dennis Cir
- 212 Williams Rd