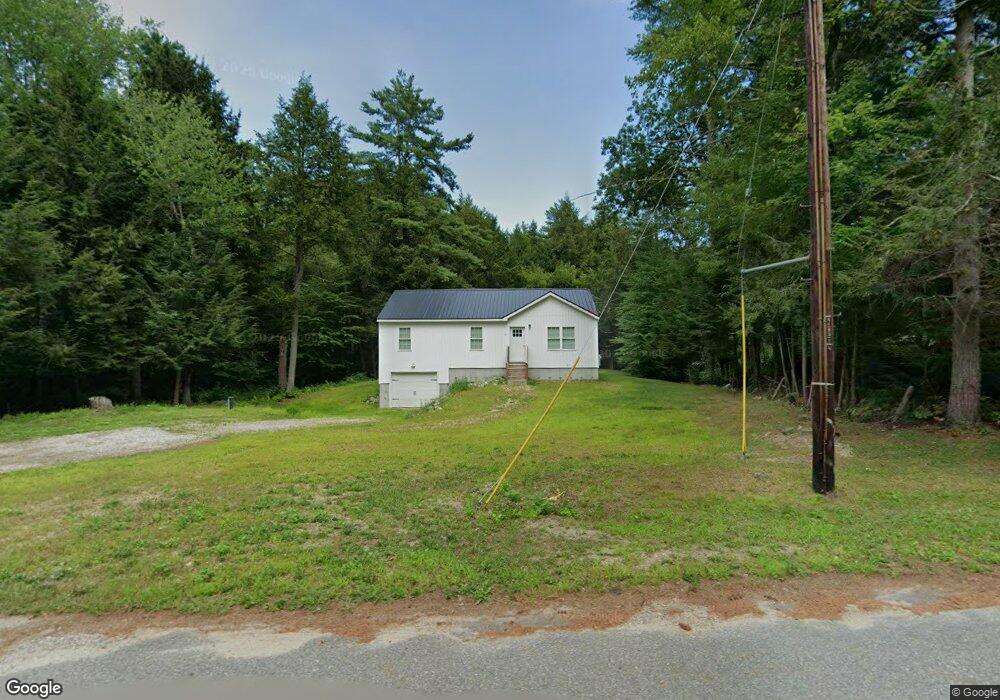
47 Horton Rd Orange, MA 01364
Estimated Value: $315,000 - $347,000
2
Beds
1
Bath
1,092
Sq Ft
$301/Sq Ft
Est. Value
About This Home
This home is located at 47 Horton Rd, Orange, MA 01364 and is currently estimated at $328,163, approximately $300 per square foot. 47 Horton Rd is a home located in Franklin County with nearby schools including Fisher Hill and Ralph C Mahar Regional School.
Ownership History
Date
Name
Owned For
Owner Type
Purchase Details
Closed on
May 26, 2023
Sold by
73 Willard Road Llc
Bought by
Mallette Dustin
Current Estimated Value
Home Financials for this Owner
Home Financials are based on the most recent Mortgage that was taken out on this home.
Original Mortgage
$234,025
Outstanding Balance
$227,374
Interest Rate
6.27%
Mortgage Type
FHA
Estimated Equity
$100,789
Create a Home Valuation Report for This Property
The Home Valuation Report is an in-depth analysis detailing your home's value as well as a comparison with similar homes in the area
Home Values in the Area
Average Home Value in this Area
Purchase History
We collect this data history from publicly available records. To have your information removed, we recommend requesting removal directly through your county’s website.
| Date | Buyer | Sale Price | Title Company |
|---|---|---|---|
| Mallette Dustin | $275,000 | None Available |
Source: Public Records
Mortgage History
We collect this data history from publicly available records. To have your information removed, we recommend requesting removal directly through your county’s website.
| Date | Status | Borrower | Loan Amount |
|---|---|---|---|
| Open | Mallette Dustin | $234,025 |
Source: Public Records
Tax History
| Year | Tax Paid | Tax Assessment Tax Assessment Total Assessment is a certain percentage of the fair market value that is determined by local assessors to be the total taxable value of land and additions on the property. | Land | Improvement |
|---|---|---|---|---|
| 2025 | $4,863 | $295,600 | $29,000 | $266,600 |
| 2024 | $4,358 | $249,900 | $29,000 | $220,900 |
| 2023 | $4,125 | $229,700 | $29,000 | $200,700 |
| 2022 | $572 | $29,900 | $29,000 | $900 |
| 2021 | $878 | $43,800 | $42,900 | $900 |
| 2020 | $850 | $41,800 | $40,900 | $900 |
| 2019 | $845 | $37,500 | $36,600 | $900 |
| 2018 | $796 | $36,300 | $35,400 | $900 |
| 2017 | $771 | $36,300 | $35,400 | $900 |
| 2016 | $768 | $35,400 | $35,400 | $0 |
| 2015 | $829 | $39,900 | $31,500 | $8,400 |
| 2014 | $709 | $35,900 | $27,500 | $8,400 |
Source: Public Records
Map
Nearby Homes
- 0 S Main St
- 2106 White Pond Rd
- 15 Johnson Rd
- 74 Earl Dr
- 742 Daniel Shays Hwy Unit 1F
- 610 S Main St
- 0 Quabbin Blvd
- 00 S Main St
- 000 S Main St
- 31 Camp Rd
- 0 Camp Rd
- 2 Fay Rd
- 0 Riceville Rd Unit 73429842
- 116 New Athal Rd
- 1478 Conant Rd
- 52 East Rd
- 990 S Main St
- 41 Russ St
- 150 E Main St
- 246 Holtshire Rd Unit Lot 3
Your Personal Tour Guide
Ask me questions while you tour the home.