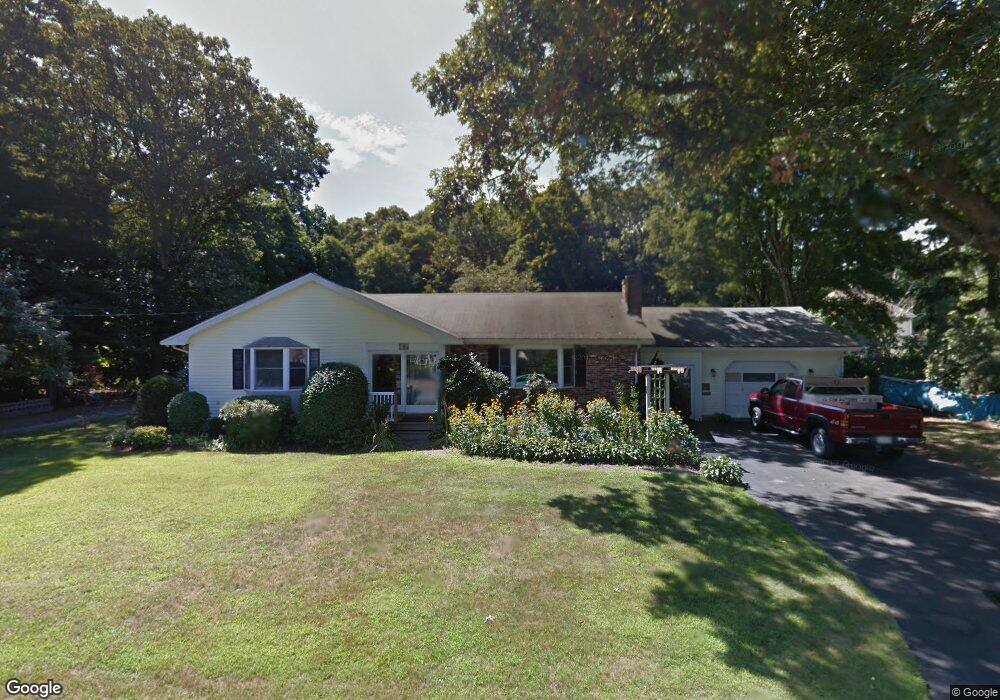
47 Howe St Mansfield, MA 02048
Estimated Value: $558,000 - $646,000
2
Beds
1
Bath
1,588
Sq Ft
$377/Sq Ft
Est. Value
About This Home
This home is located at 47 Howe St, Mansfield, MA 02048 and is currently estimated at $598,636, approximately $376 per square foot. 47 Howe St is a home located in Bristol County with nearby schools including Everett W. Robinson Elementary School, Jordan/Jackson Elementary School, and Harold L. Qualters Middle School.
Ownership History
Date
Name
Owned For
Owner Type
Purchase Details
Closed on
Jul 23, 2021
Sold by
Depillo Peter J
Bought by
Depillo Peter J and Romiza-Depillo Judith
Current Estimated Value
Home Financials for this Owner
Home Financials are based on the most recent Mortgage that was taken out on this home.
Original Mortgage
$162,000
Outstanding Balance
$146,739
Interest Rate
2.93%
Mortgage Type
New Conventional
Estimated Equity
$451,897
Purchase Details
Closed on
Apr 14, 2005
Sold by
Depillo James J and Depillo Ralph
Bought by
Depillo Peter J
Home Financials for this Owner
Home Financials are based on the most recent Mortgage that was taken out on this home.
Original Mortgage
$150,000
Interest Rate
5.78%
Mortgage Type
Purchase Money Mortgage
Create a Home Valuation Report for This Property
The Home Valuation Report is an in-depth analysis detailing your home's value as well as a comparison with similar homes in the area
Home Values in the Area
Average Home Value in this Area
Purchase History
| Date | Buyer | Sale Price | Title Company |
|---|---|---|---|
| Depillo Peter J | -- | None Available | |
| Depillo Peter J | -- | None Available | |
| Depillo Peter J | $278,000 | -- | |
| Depillo Peter J | $278,000 | -- | |
| Depillo Peter J | $278,000 | -- |
Source: Public Records
Mortgage History
| Date | Status | Borrower | Loan Amount |
|---|---|---|---|
| Open | Depillo Peter J | $162,000 | |
| Closed | Depillo Peter J | $162,000 | |
| Previous Owner | Depillo Peter J | $150,000 |
Source: Public Records
Tax History
| Year | Tax Paid | Tax Assessment Tax Assessment Total Assessment is a certain percentage of the fair market value that is determined by local assessors to be the total taxable value of land and additions on the property. | Land | Improvement |
|---|---|---|---|---|
| 2025 | $6,993 | $531,000 | $206,700 | $324,300 |
| 2024 | $6,359 | $471,000 | $206,700 | $264,300 |
| 2023 | $6,066 | $430,500 | $206,700 | $223,800 |
| 2022 | $5,843 | $385,200 | $191,400 | $193,800 |
| 2021 | $5,923 | $385,600 | $177,200 | $208,400 |
| 2020 | $5,828 | $379,400 | $177,200 | $202,200 |
| 2019 | $5,598 | $367,800 | $147,700 | $220,100 |
| 2018 | $5,107 | $328,000 | $133,700 | $194,300 |
| 2017 | $5,030 | $334,900 | $129,800 | $205,100 |
| 2016 | $5,067 | $328,800 | $130,200 | $198,600 |
| 2015 | $4,495 | $290,000 | $123,700 | $166,300 |
Source: Public Records
Map
Nearby Homes
- 166 Chauncy St
- 150 Rumford Ave Unit 110
- 22 Pleasant St Unit B
- 266 N Main St Unit 3
- 25 Kingman Ave
- 619 N Main St
- 28 Court St
- 122 Samoset Ave
- 356 Central St
- 44 Fairfield Park Unit 44
- 46 Hope St
- 97 East St
- 1769 West St
- 233 Central St
- 631 East St Unit L101
- 7 Fieldstone Dr
- 1 Deer Path Ln
- 157 Central St
- 261 East St
- 155 South St
Your Personal Tour Guide
Ask me questions while you tour the home.