
Seller's Agent in 2019
John Gallagher
Coastal Countryside Properties
30 Total Sales
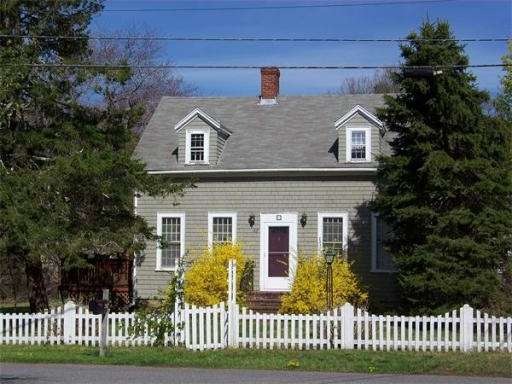
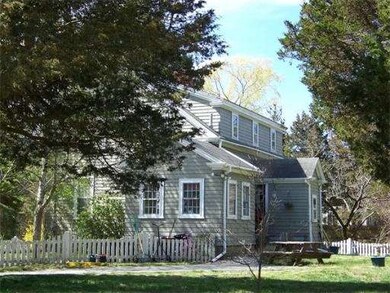
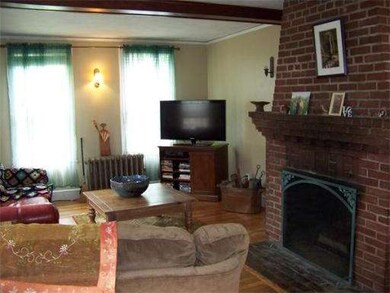
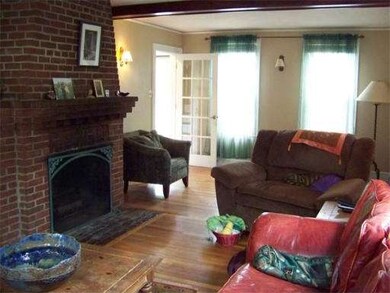
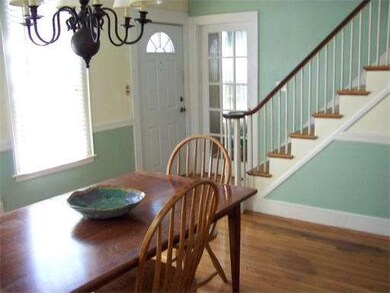
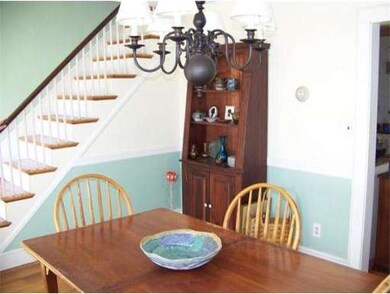
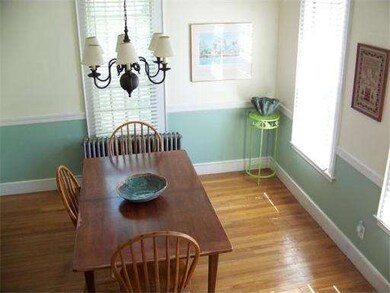
Charming Cape situated on .32 acre corner lot....Family friendly neighborhood....Hardwood floors up & down.....Living room w/fireplace and access to 20x10 deck....Spacious kitchen w/granite counters & built-in china cabinet....Sun room....Formal Dining room....Spacious MBR...Convenient location to downtown & beaches...
Home Type
Single Family
Est. Annual Taxes
$5,963
Year Built
1935
Lot Details
0
| Date | Type | Sale Price | Title Company |
|---|---|---|---|
| Not Resolvable | $451,000 | -- | |
| Not Resolvable | $310,300 | -- | |
| Deed | $400,000 | -- | |
| Deed | $400,000 | -- | |
| Deed | $275,000 | -- | |
| Deed | $275,000 | -- |
| Date | Status | Loan Amount | Loan Type |
|---|---|---|---|
| Open | $360,800 | New Conventional | |
| Closed | $360,800 | New Conventional | |
| Previous Owner | $294,785 | New Conventional | |
| Previous Owner | $188,452 | No Value Available |
| Date | Event | Price | Change | Sq Ft Price |
|---|---|---|---|---|
| 09/12/2019 09/12/19 | Sold | $451,000 | +1.3% | $300 / Sq Ft |
| 06/11/2019 06/11/19 | Pending | -- | -- | -- |
| 06/05/2019 06/05/19 | For Sale | $445,000 | +43.4% | $296 / Sq Ft |
| 09/27/2013 09/27/13 | Sold | $310,300 | -2.7% | $206 / Sq Ft |
| 08/08/2013 08/08/13 | Pending | -- | -- | -- |
| 07/11/2013 07/11/13 | Price Changed | $319,000 | -3.0% | $212 / Sq Ft |
| 06/28/2013 06/28/13 | Price Changed | $329,000 | -2.9% | $218 / Sq Ft |
| 06/14/2013 06/14/13 | Price Changed | $339,000 | -2.9% | $225 / Sq Ft |
| 06/02/2013 06/02/13 | Price Changed | $349,000 | -1.7% | $231 / Sq Ft |
| 05/23/2013 05/23/13 | Price Changed | $354,900 | -1.1% | $235 / Sq Ft |
| 05/10/2013 05/10/13 | For Sale | $359,000 | -- | $238 / Sq Ft |
| Year | Tax Paid | Tax Assessment Tax Assessment Total Assessment is a certain percentage of the fair market value that is determined by local assessors to be the total taxable value of land and additions on the property. | Land | Improvement |
|---|---|---|---|---|
| 2025 | $5,963 | $602,300 | $298,600 | $303,700 |
| 2024 | $5,828 | $560,900 | $284,300 | $276,600 |
| 2023 | $5,392 | $494,300 | $253,900 | $240,400 |
| 2022 | $5,392 | $416,400 | $213,200 | $203,200 |
| 2021 | $5,202 | $394,400 | $213,200 | $181,200 |
| 2020 | $4,987 | $374,100 | $192,900 | $181,200 |
| 2019 | $4,350 | $325,100 | $192,900 | $132,200 |
| 2018 | $4,254 | $318,200 | $192,900 | $125,300 |
| 2017 | $4,187 | $305,200 | $192,900 | $112,300 |
| 2016 | $4,160 | $299,700 | $192,900 | $106,800 |
| 2015 | $3,983 | $299,700 | $192,900 | $106,800 |
| 2014 | $3,891 | $292,800 | $192,900 | $99,900 |
Seller's Agent in 2019
John Gallagher
Coastal Countryside Properties
30 Total Sales
T
Buyer's Agent in 2019
Timothy Driscoll
Coldwell Banker Realty - Duxbury
D
Seller's Agent in 2013
Dorothy McGrath
Waterfront Realty Group
(781) 837-5600
8 in this area
18 Total Sales
Source: MLS Property Information Network (MLS PIN)
MLS Number: 71523690
APN: MARS-000009J-000009-000004
Disclaimer: Certain information contained herein is derived from information provided by parties other than Homes.com. All information provided is deemed reliable, but is not guaranteed to be accurate and should be independently verified.
![]() The property listing data and information, or the Images, set forth herein were provided to MLS Property Information Network, Inc. from third party sources, including sellers, lessors and public records, and were compiled by MLS Property Information Network, Inc. The property listing data and information, and the Images, are for the personal, non-commercial use of consumers having a good faith interest in purchasing or leasing listed properties of the type displayed to them and may not be used for any purpose other than to identify prospective properties which such consumers may have a good faith interest in purchasing or leasing. MLS Property Information Network, Inc. and its subscribers disclaim any and all representations and warranties as to the accuracy of the property listing data and information, or as to the accuracy of any of the Images, set forth herein.
The property listing data and information, or the Images, set forth herein were provided to MLS Property Information Network, Inc. from third party sources, including sellers, lessors and public records, and were compiled by MLS Property Information Network, Inc. The property listing data and information, and the Images, are for the personal, non-commercial use of consumers having a good faith interest in purchasing or leasing listed properties of the type displayed to them and may not be used for any purpose other than to identify prospective properties which such consumers may have a good faith interest in purchasing or leasing. MLS Property Information Network, Inc. and its subscribers disclaim any and all representations and warranties as to the accuracy of the property listing data and information, or as to the accuracy of any of the Images, set forth herein.