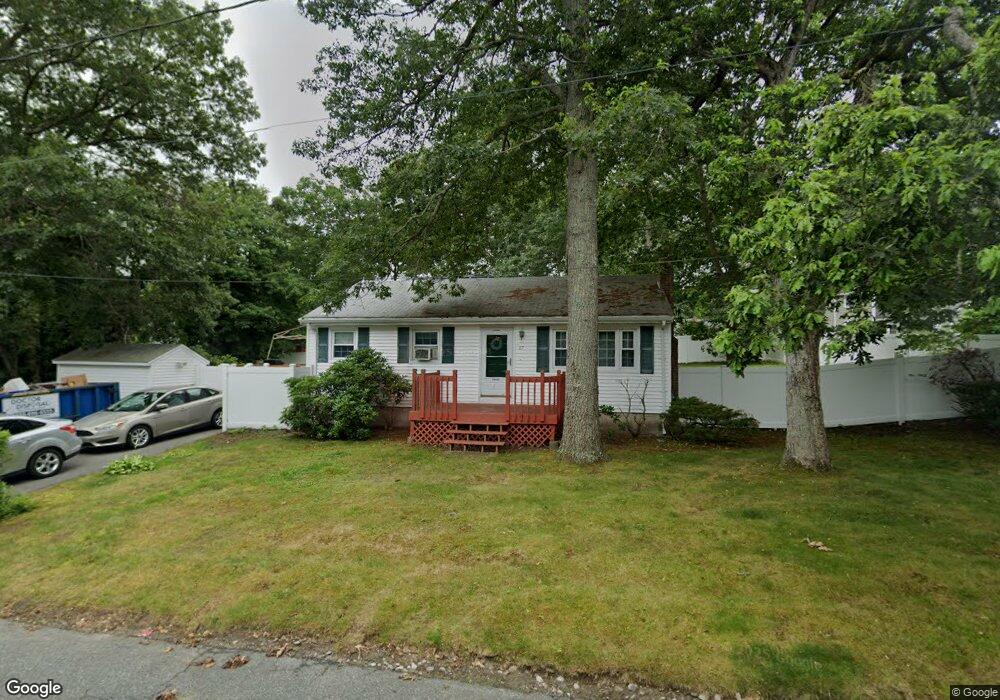
47 Kimberly Dr Whitman, MA 02382
Estimated Value: $523,393 - $645,000
3
Beds
1
Bath
1,404
Sq Ft
$403/Sq Ft
Est. Value
About This Home
This home is located at 47 Kimberly Dr, Whitman, MA 02382 and is currently estimated at $565,598, approximately $402 per square foot. 47 Kimberly Dr is a home located in Plymouth County with nearby schools including Trinity Catholic Academy, Brockton Area Seventh-Day Adventist Academy, and Cardinal Spellman High School.
Ownership History
Date
Name
Owned For
Owner Type
Purchase Details
Closed on
Oct 14, 2023
Sold by
Mcconkey Theresa A and Mcconkey Lewis F
Bought by
Mcconkey Lt and Mcconkey
Current Estimated Value
Purchase Details
Closed on
May 31, 1996
Sold by
Richards Wayne and Richards Roderica
Bought by
Mcconkey Theresa A and Mcconkey Lewis F
Home Financials for this Owner
Home Financials are based on the most recent Mortgage that was taken out on this home.
Original Mortgage
$128,250
Interest Rate
7.91%
Mortgage Type
Purchase Money Mortgage
Create a Home Valuation Report for This Property
The Home Valuation Report is an in-depth analysis detailing your home's value as well as a comparison with similar homes in the area
Home Values in the Area
Average Home Value in this Area
Purchase History
| Date | Buyer | Sale Price | Title Company |
|---|---|---|---|
| Mcconkey Lt | -- | None Available | |
| Mcconkey Theresa A | $135,000 | -- |
Source: Public Records
Mortgage History
| Date | Status | Borrower | Loan Amount |
|---|---|---|---|
| Previous Owner | Mcconkey Theresa A | $135,000 | |
| Previous Owner | Mcconkey Theresa A | $128,250 | |
| Previous Owner | Mcconkey Theresa A | $73,000 |
Source: Public Records
Tax History
| Year | Tax Paid | Tax Assessment Tax Assessment Total Assessment is a certain percentage of the fair market value that is determined by local assessors to be the total taxable value of land and additions on the property. | Land | Improvement |
|---|---|---|---|---|
| 2025 | $6,106 | $465,400 | $232,800 | $232,600 |
| 2024 | $5,706 | $447,900 | $228,700 | $219,200 |
| 2023 | $5,462 | $402,500 | $198,900 | $203,600 |
| 2022 | $5,320 | $365,400 | $180,500 | $184,900 |
| 2021 | $5,051 | $325,900 | $158,900 | $167,000 |
| 2020 | $4,874 | $307,500 | $150,700 | $156,800 |
| 2019 | $4,549 | $295,800 | $150,700 | $145,100 |
| 2018 | $4,336 | $270,800 | $138,400 | $132,400 |
| 2017 | $4,084 | $270,800 | $138,400 | $132,400 |
| 2016 | $4,061 | $260,500 | $133,300 | $127,200 |
| 2015 | $4,066 | $260,500 | $133,300 | $127,200 |
Source: Public Records
Map
Nearby Homes
Your Personal Tour Guide
Ask me questions while you tour the home.