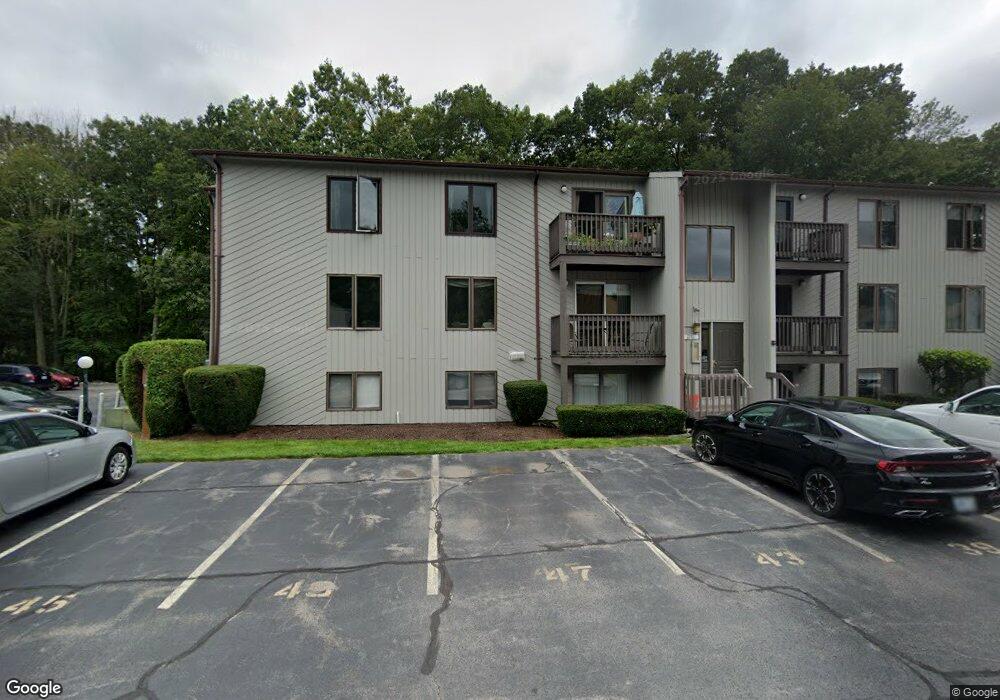
47 Kristee Cir West Warwick, RI 02893
Crompton NeighborhoodEstimated Value: $254,000 - $265,000
2
Beds
2
Baths
960
Sq Ft
$271/Sq Ft
Est. Value
About This Home
This home is located at 47 Kristee Cir, West Warwick, RI 02893 and is currently estimated at $259,810, approximately $270 per square foot. 47 Kristee Cir is a home located in Kent County with nearby schools including West Warwick High School.
Ownership History
Date
Name
Owned For
Owner Type
Purchase Details
Closed on
Dec 1, 2016
Sold by
Ri Housing & Mtg Fin Cor
Bought by
Kennelly Shannon D
Current Estimated Value
Home Financials for this Owner
Home Financials are based on the most recent Mortgage that was taken out on this home.
Original Mortgage
$72,400
Outstanding Balance
$58,462
Interest Rate
3.52%
Mortgage Type
Unknown
Estimated Equity
$201,348
Purchase Details
Closed on
Jul 18, 2008
Sold by
Bellenoit Irene
Bought by
Bellenoit Elaine
Home Financials for this Owner
Home Financials are based on the most recent Mortgage that was taken out on this home.
Original Mortgage
$117,600
Interest Rate
6.17%
Mortgage Type
Purchase Money Mortgage
Purchase Details
Closed on
Feb 20, 2003
Sold by
Robinson Linda A
Bought by
Bellenoit Irene
Purchase Details
Closed on
Jan 28, 2002
Sold by
Lobuono Vincenzo F
Bought by
Robinson Linda A
Create a Home Valuation Report for This Property
The Home Valuation Report is an in-depth analysis detailing your home's value as well as a comparison with similar homes in the area
Home Values in the Area
Average Home Value in this Area
Purchase History
| Date | Buyer | Sale Price | Title Company |
|---|---|---|---|
| Kennelly Shannon D | $92,400 | -- | |
| Bellenoit Elaine | $147,000 | -- | |
| Bellenoit Irene | $118,000 | -- | |
| Robinson Linda A | $108,000 | -- |
Source: Public Records
Mortgage History
| Date | Status | Borrower | Loan Amount |
|---|---|---|---|
| Open | Kennelly Shannon D | $72,400 | |
| Previous Owner | Robinson Linda A | $117,600 | |
| Previous Owner | Robinson Linda A | $50,000 | |
| Previous Owner | Robinson Linda A | $25,000 |
Source: Public Records
Tax History Compared to Growth
Tax History
| Year | Tax Paid | Tax Assessment Tax Assessment Total Assessment is a certain percentage of the fair market value that is determined by local assessors to be the total taxable value of land and additions on the property. | Land | Improvement |
|---|---|---|---|---|
| 2025 | $3,231 | $226,100 | $0 | $226,100 |
| 2024 | $2,975 | $159,200 | $0 | $159,200 |
| 2023 | $2,917 | $159,200 | $0 | $159,200 |
| 2022 | $2,872 | $159,200 | $0 | $159,200 |
| 2021 | $2,916 | $126,800 | $0 | $126,800 |
| 2020 | $2,916 | $126,800 | $0 | $126,800 |
| 2019 | $3,718 | $126,800 | $0 | $126,800 |
| 2018 | $3,074 | $113,100 | $0 | $113,100 |
| 2017 | $2,976 | $113,100 | $0 | $113,100 |
| 2016 | $2,923 | $113,100 | $0 | $113,100 |
| 2015 | $2,892 | $111,400 | $0 | $111,400 |
| 2014 | $2,828 | $111,400 | $0 | $111,400 |
Source: Public Records
Map
Nearby Homes
- 76 Sycamore Dr
- 45 Judy Terrace
- 33 Judy Terrace
- 30 Birchwood Ln
- 565 Quaker Ln Unit 58
- 565 Quaker Ln Unit 124
- 177 Cowesett Ave
- 170 Cowesett Ave
- 750 Quaker Ln Unit B101
- 125 Setian Ln
- 500 E Greenwich Ave Unit 116
- 500 E Greenwich Ave Unit 101
- 34 Silverwood Ln
- 34 Buckley Ave
- 64 Lockwood St
- 16 Ontario St
- 46 Trellis Dr
- 94 Cowesett Ave Unit 8
- 25 Fawn Ln
- 101 Quaker Ln
- 46 Kristee Cir
- 47 Kristee Cir Unit 47
- 40 Kristee Cir
- 40 Kristee Cir Unit 40
- 39 Kristee Cir
- 41 Kristee Cir
- 48 Kristee Cir
- 48 Kristee Cir Unit 48
- 42 Kristee Cir
- 49 Kristee Cir
- 43 Kristee Cir
- 43 Kristee Cir Unit 43
- 50 Kristee Cir
- 44 Kristee Cir
- 32 Kristee Cir
- 32 Kristee Cir
- 32 Kristee Cir Unit 32
- 32 Kristee Cir Unit 33
- 38 Kristee Cir
- 31 Kristee Cir