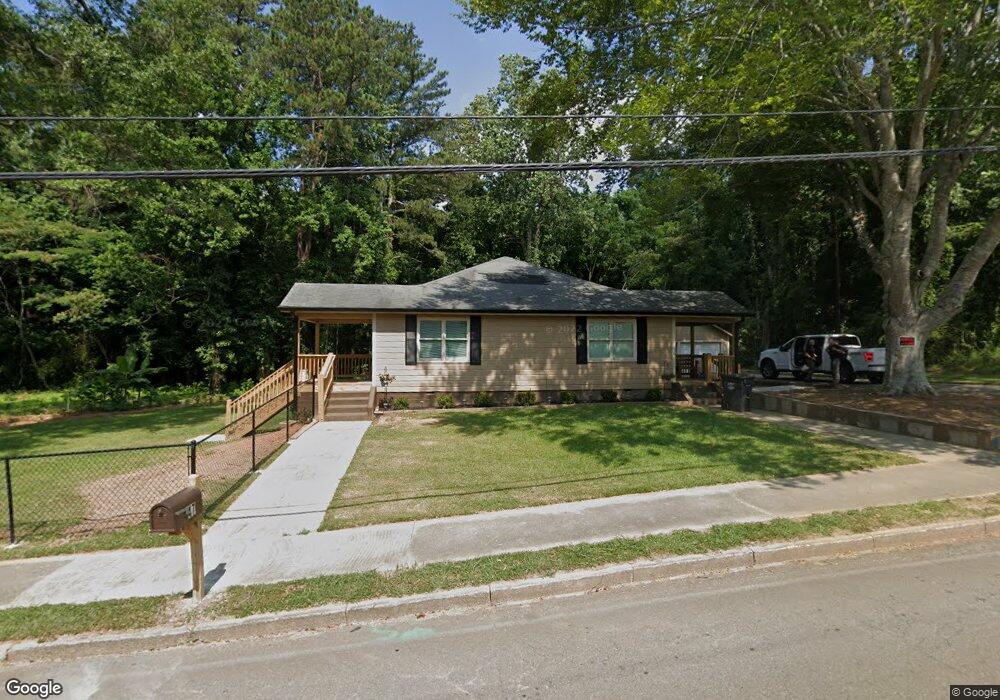
47 Lakeview Dr Canton, GA 30114
Estimated Value: $215,000 - $277,742
2
Beds
2
Baths
1,258
Sq Ft
$195/Sq Ft
Est. Value
About This Home
This home is located at 47 Lakeview Dr, Canton, GA 30114 and is currently estimated at $245,186, approximately $194 per square foot. 47 Lakeview Dr is a home located in Cherokee County with nearby schools including R. M. Moore Elementary School, Teasley Middle School, and Cherokee High School.
Ownership History
Date
Name
Owned For
Owner Type
Purchase Details
Closed on
May 7, 2021
Sold by
Cook Tracy A
Bought by
Cruz Marisela
Current Estimated Value
Purchase Details
Closed on
Jul 21, 2011
Sold by
Secretary Of Housing And U
Bought by
Cook Tracy A
Purchase Details
Closed on
Nov 3, 2009
Sold by
Wells Fargo Bk Na
Bought by
Hud-Housing Of Urban Dev
Purchase Details
Closed on
Jan 5, 2000
Sold by
Johnson Jennifer F
Bought by
Ramirez Enrique
Home Financials for this Owner
Home Financials are based on the most recent Mortgage that was taken out on this home.
Original Mortgage
$92,652
Interest Rate
7.87%
Mortgage Type
FHA
Purchase Details
Closed on
Oct 30, 1998
Sold by
Dejarnett Christopher and Dejarnett Carolyn
Bought by
Johnson Jennifer F
Home Financials for this Owner
Home Financials are based on the most recent Mortgage that was taken out on this home.
Original Mortgage
$77,600
Interest Rate
6.65%
Mortgage Type
New Conventional
Purchase Details
Closed on
May 13, 1996
Sold by
Vinson Dorothy P Executrix
Bought by
Dejarnett Christopher Caroly
Create a Home Valuation Report for This Property
The Home Valuation Report is an in-depth analysis detailing your home's value as well as a comparison with similar homes in the area
Home Values in the Area
Average Home Value in this Area
Purchase History
| Date | Buyer | Sale Price | Title Company |
|---|---|---|---|
| Cruz Marisela | $165,000 | -- | |
| Cook Tracy A | $23,500 | -- | |
| Hud-Housing Of Urban Dev | -- | -- | |
| Wells Fargo Bk Na | $106,970 | -- | |
| Ramirez Enrique | $92,700 | -- | |
| Johnson Jennifer F | $79,900 | -- | |
| Dejarnett Christopher Caroly | $55,900 | -- |
Source: Public Records
Mortgage History
| Date | Status | Borrower | Loan Amount |
|---|---|---|---|
| Previous Owner | Ramirez Enrique | $92,652 | |
| Previous Owner | Johnson Jennifer F | $77,600 | |
| Closed | Dejarnett Christopher Caroly | $0 |
Source: Public Records
Tax History
| Year | Tax Paid | Tax Assessment Tax Assessment Total Assessment is a certain percentage of the fair market value that is determined by local assessors to be the total taxable value of land and additions on the property. | Land | Improvement |
|---|---|---|---|---|
| 2025 | $2,905 | $100,964 | $18,400 | $82,564 |
| 2024 | $2,575 | $89,964 | $16,000 | $73,964 |
| 2023 | $2,454 | $85,724 | $14,000 | $71,724 |
| 2022 | $1,878 | $65,444 | $13,200 | $52,244 |
| 2021 | $42 | $44,040 | $10,800 | $33,240 |
| 2020 | $43 | $42,640 | $10,800 | $31,840 |
| 2019 | $995 | $39,840 | $9,600 | $30,240 |
| 2018 | $814 | $32,680 | $7,200 | $25,480 |
| 2017 | $624 | $81,500 | $7,200 | $25,400 |
| 2016 | $624 | $79,500 | $7,200 | $24,600 |
| 2015 | $541 | $68,500 | $6,000 | $21,400 |
| 2014 | $401 | $39,200 | $4,800 | $10,880 |
Source: Public Records
Map
Nearby Homes
- 140 Juniper St
- 100 Daisy Cir
- Lot2&3 Georgia 140
- 80 Daisy Cir
- 70 Daisy Cir
- 560 Waleska Rd
- 550 Waleska Rd
- 284 Shoal Creek Rd
- 105 Mashburn Place
- 122 Mashburn Place
- 234 Riverstone Place
- 257 Riverstone Place Unit 55
- 248 Riverstone Place
- 260 Riverstone Place
- 116 Franklin Hills Ct
- 212 Riverstone Commons Cir
- 6 Lots Riverstone Commons Cir
- 235 Riverstone Commons Cir
- 1028 Whispering Woods Dr
- 791 Waleska Rd
- 55 Lakeview Dr
- 50 Lakeview Dr
- 39 Lakeview Dr
- 46 Lakeview Dr
- 203 Oakside Ln Unit F
- 54 Lakeview Dr
- 59 Lakeview Dr Unit 111
- 59 Lakeview Dr
- 58 Lakeview Dr
- 40 Lakeview Dr
- 62 Lakeview Dr
- 36 Lakeview Dr
- 65 Lakeview Dr
- 0 W Lakeview Dr
- 0 W Lakeview Dr Unit 6925367
- 200 Oakside Ln Unit D
- 200 Oakside Ln
- 32 Lakeview Dr
- 120 Oakside Ct Unit Ste B
- 120 Oakside Ct Unit Ste A
Your Personal Tour Guide
Ask me questions while you tour the home.