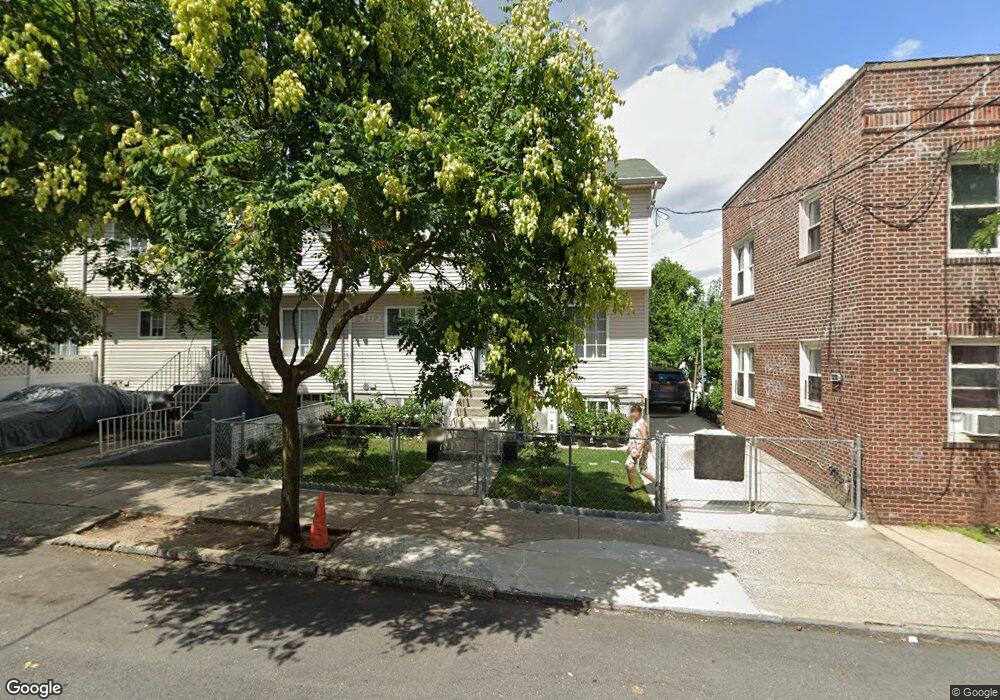
47 Laurel Ave Staten Island, NY 10304
Stapleton NeighborhoodEstimated Value: $473,000 - $635,000
--
Bed
1
Bath
1,040
Sq Ft
$527/Sq Ft
Est. Value
About This Home
This home is located at 47 Laurel Ave, Staten Island, NY 10304 and is currently estimated at $548,202, approximately $527 per square foot. 47 Laurel Ave is a home located in Richmond County with nearby schools including P.S. 78, P.S./I.S. 78Q Early Childhood Center, and I.S. 49 Berta A Dreyfus.
Ownership History
Date
Name
Owned For
Owner Type
Purchase Details
Closed on
Jan 24, 2019
Sold by
Unity One Llc
Bought by
Liu Bing Qi and Wei Shao Fen
Current Estimated Value
Home Financials for this Owner
Home Financials are based on the most recent Mortgage that was taken out on this home.
Original Mortgage
$262,000
Outstanding Balance
$230,351
Interest Rate
4.6%
Mortgage Type
New Conventional
Estimated Equity
$317,851
Purchase Details
Closed on
Jan 25, 2018
Sold by
Fiore Angela
Bought by
Wilmington Savings Fund Society Fsb and Stanwich Mortgage Loan Trust A
Purchase Details
Closed on
Jun 30, 2003
Sold by
Gotham Realty Associates Ltd
Bought by
Winfield Georgener and Nicholson Jeffrey
Home Financials for this Owner
Home Financials are based on the most recent Mortgage that was taken out on this home.
Original Mortgage
$236,292
Interest Rate
6.35%
Mortgage Type
FHA
Purchase Details
Closed on
Mar 5, 2003
Sold by
G S Targee Inc
Bought by
Gotham Realty Associates Ltd
Create a Home Valuation Report for This Property
The Home Valuation Report is an in-depth analysis detailing your home's value as well as a comparison with similar homes in the area
Home Values in the Area
Average Home Value in this Area
Purchase History
| Date | Buyer | Sale Price | Title Company |
|---|---|---|---|
| Liu Bing Qi | $362,000 | Stewart Title Insurance Co | |
| Wilmington Savings Fund Society Fsb | $310,000 | First American Title Insuran | |
| Winfield Georgener | $240,000 | Fidelity Natl Title Ins Co N | |
| Gotham Realty Associates Ltd | $190,000 | First American Title Ins Co |
Source: Public Records
Mortgage History
| Date | Status | Borrower | Loan Amount |
|---|---|---|---|
| Open | Liu Bing Qi | $262,000 | |
| Previous Owner | Winfield Georgener | $236,292 |
Source: Public Records
Tax History Compared to Growth
Tax History
| Year | Tax Paid | Tax Assessment Tax Assessment Total Assessment is a certain percentage of the fair market value that is determined by local assessors to be the total taxable value of land and additions on the property. | Land | Improvement |
|---|---|---|---|---|
| 2025 | $1,955 | $30,180 | $3,353 | $26,827 |
| 2024 | $1,955 | $28,800 | $3,487 | $25,313 |
| 2023 | $1,865 | $18,363 | $3,270 | $15,093 |
| 2022 | $1,729 | $23,580 | $5,160 | $18,420 |
| 2021 | $3,440 | $21,720 | $5,160 | $16,560 |
| 2020 | $3,460 | $21,660 | $5,160 | $16,500 |
| 2019 | $3,393 | $20,400 | $5,160 | $15,240 |
| 2018 | $3,120 | $15,303 | $4,507 | $10,796 |
| 2017 | $2,943 | $14,437 | $4,721 | $9,716 |
| 2016 | $2,723 | $13,620 | $5,160 | $8,460 |
| 2015 | $2,637 | $13,740 | $4,320 | $9,420 |
| 2014 | $2,637 | $13,740 | $4,320 | $9,420 |
Source: Public Records
Map
Nearby Homes
- 47 Laurel Ave
- 47 Laurel Ave
- 47 Laurel Ave
- 45 Laurel Ave
- 51 Laurel Ave
- 51 Laurel Ave Unit /57
- 279 Targee St
- 41 Laurel Ave
- 298 Gordon St
- 55-57 Laurel Ave
- 296 Gordon St
- 275 Targee St
- 294 Gordon St
- 273 Targee St
- 40 Laurel Ave
- 48 Laurel Ave
- 46 Laurel Ave Unit 2
- 46 Laurel Ave
- 46 Laurel Ave Unit 1
- 288 Gordon St