
Seller's Agent in 2026
Angela Morales
Keller Williams Realty Prtnrs.
(203) 543-6229
6 in this area
215 Total Sales
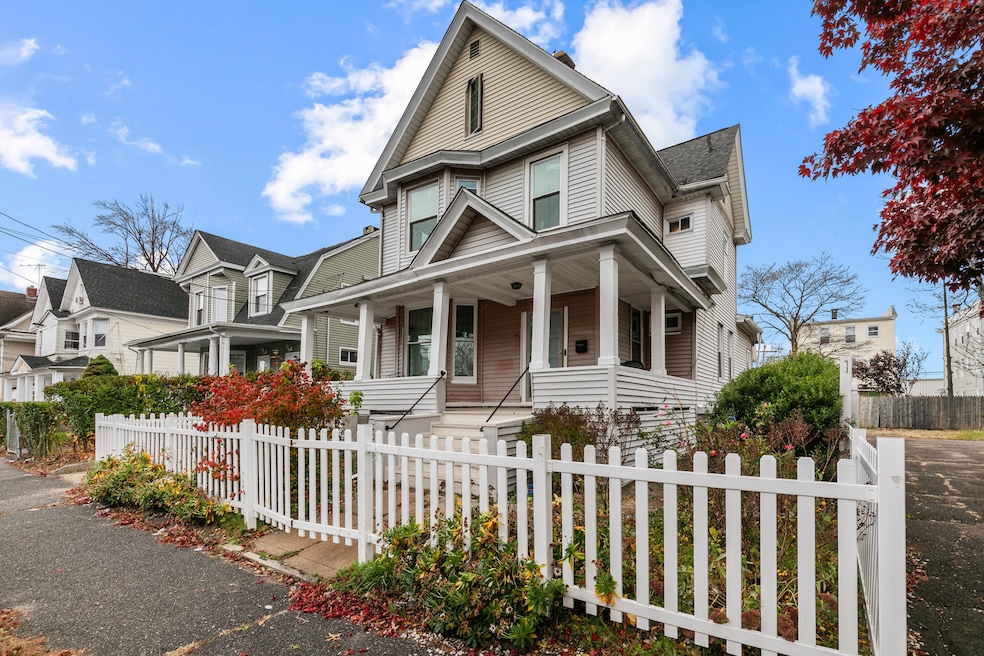
Welcome to 47 Lenox Avenue - where classic charm meets spacious living! This beautiful Colonial has high ceilings and tons of sunlight, offering 5 bedrooms, with the versatility to use one as a private office or cozy den on main floor. The main level includes a welcoming living room with a traditional fireplace, dining room, convenient full bathroom, and one bedroom with walk-in closet. Upstairs on the second floor you'll find four generously sized bedrooms, another full bathroom, and access to a third floor fully finished attic with a bonus room-perfect for 6th bedroom or creative space. The basement provides multiple rooms for storage, a workshop, or a home office with a third bathroom by the dedicated laundry area. Recent updates include a new roof installed in February, offering peace of mind for years to come. Enjoy relaxing on the spacious front porch or in the fenced backyard with mature landscaping-ideal for entertaining, gardening, or pets. A two-car garage completes this wonderful home, ready to welcome its next owners. Bring your vision to this oversized home!
Last Agent to Sell the Property
Keller Williams Realty Prtnrs. Brokerage Phone: (203) 292-0203 License #REB.0757443 Listed on: 11/12/2025
Co-Listed By
Keller Williams Realty Prtnrs. Brokerage Phone: (203) 292-0203 License #REB.0793647
| Date | Type | Sale Price | Title Company |
|---|---|---|---|
| Warranty Deed | $430,000 | -- | |
| Warranty Deed | $190,000 | -- | |
| Warranty Deed | $190,000 | -- | |
| Warranty Deed | $120,000 | -- | |
| Warranty Deed | $120,000 | -- | |
| Warranty Deed | $310,000 | -- | |
| Warranty Deed | $310,000 | -- | |
| Warranty Deed | $119,000 | -- | |
| Warranty Deed | $119,000 | -- |
| Date | Status | Loan Amount | Loan Type |
|---|---|---|---|
| Open | $408,500 | New Conventional | |
| Previous Owner | $182,793 | FHA | |
| Previous Owner | $20,550 | Credit Line Revolving | |
| Previous Owner | $117,826 | Purchase Money Mortgage |
| Date | Event | Price | List to Sale | Price per Sq Ft |
|---|---|---|---|---|
| 01/28/2026 01/28/26 | Sold | $430,000 | +7.8% | $172 / Sq Ft |
| 12/03/2025 12/03/25 | Pending | -- | -- | -- |
| 11/15/2025 11/15/25 | For Sale | $399,000 | -- | $159 / Sq Ft |
| Year | Tax Paid | Tax Assessment Tax Assessment Total Assessment is a certain percentage of the fair market value that is determined by local assessors to be the total taxable value of land and additions on the property. | Land | Improvement |
|---|---|---|---|---|
| 2025 | $6,983 | $160,710 | $51,970 | $108,740 |
| 2024 | $6,983 | $160,710 | $51,970 | $108,740 |
| 2023 | $6,983 | $160,710 | $51,970 | $108,740 |
| 2022 | $6,983 | $160,710 | $51,970 | $108,740 |
| 2021 | $6,983 | $160,710 | $51,970 | $108,740 |
| 2020 | $5,837 | $108,120 | $15,740 | $92,380 |
| 2019 | $5,837 | $108,120 | $15,740 | $92,380 |
| 2018 | $5,878 | $108,120 | $15,740 | $92,380 |
| 2017 | $5,878 | $108,120 | $15,740 | $92,380 |
| 2016 | $5,878 | $108,120 | $15,740 | $92,380 |
| 2015 | $5,802 | $137,480 | $23,810 | $113,670 |
| 2014 | $5,802 | $137,480 | $23,810 | $113,670 |
Seller's Agent in 2026
Angela Morales
Keller Williams Realty Prtnrs.
(203) 543-6229
6 in this area
215 Total Sales
Seller Co-Listing Agent in 2026
Johncarlo Morales
Keller Williams Realty Prtnrs.
(203) 296-0299
5 in this area
103 Total Sales
S
Buyer's Agent in 2026
Shawnalee Wray
Larracuente & Johnson Realty, LLC
(347) 499-6610
1 in this area
4 Total Sales
Source: SmartMLS
MLS Number: 24137372
APN: BRID-001217-000033
Disclaimer: Certain information contained herein is derived from information provided by parties other than Homes.com. All information provided is deemed reliable, but is not guaranteed to be accurate and should be independently verified.
![]() IDX information is provided exclusively for personal, non-commercial use, and may not be used for any purpose other than to identify prospective properties consumers may be interested in purchasing. Information is deemed reliable but not guaranteed.
IDX information is provided exclusively for personal, non-commercial use, and may not be used for any purpose other than to identify prospective properties consumers may be interested in purchasing. Information is deemed reliable but not guaranteed.
Ask me questions while you tour the home.