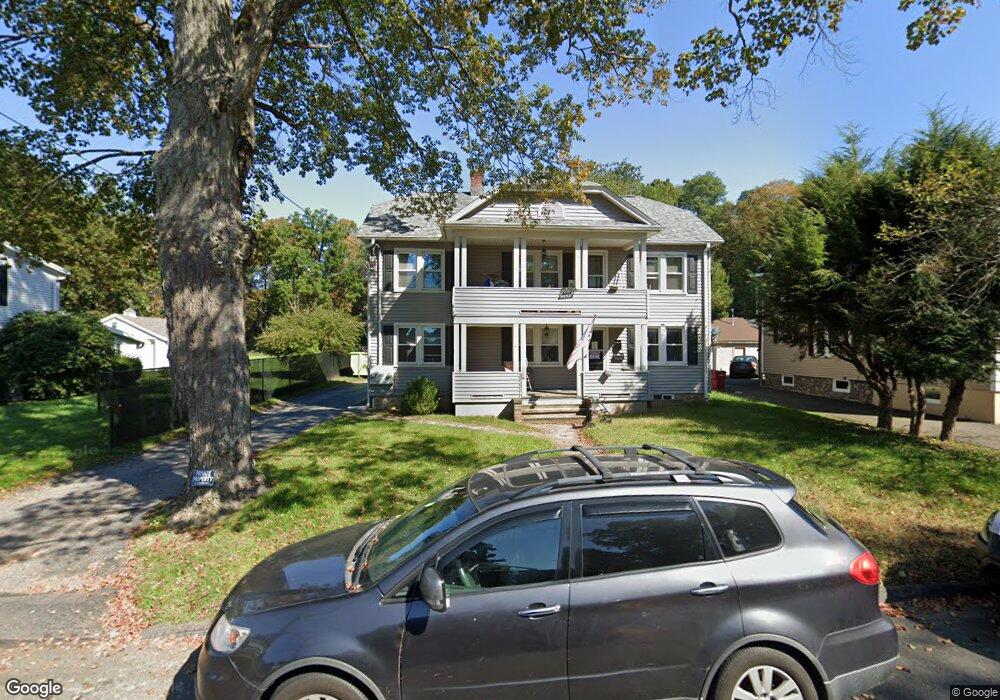
47 Locust St Naugatuck, CT 06770
Estimated Value: $355,013 - $452,000
4
Beds
2
Baths
2,080
Sq Ft
$197/Sq Ft
Est. Value
About This Home
This home is located at 47 Locust St, Naugatuck, CT 06770 and is currently estimated at $409,753, approximately $196 per square foot. 47 Locust St is a home located in New Haven County with nearby schools including City Hill Middle School and Naugatuck High School.
Ownership History
Date
Name
Owned For
Owner Type
Purchase Details
Closed on
Nov 10, 2015
Sold by
Smith Jonathan R
Bought by
Kenneson Kimberly
Current Estimated Value
Purchase Details
Closed on
Jun 20, 2012
Sold by
Smith Cathy E
Bought by
Smith Jonathan R
Purchase Details
Closed on
Feb 7, 2008
Sold by
Mazanski Mark Est and Sullivan
Bought by
Smith Jonathan
Home Financials for this Owner
Home Financials are based on the most recent Mortgage that was taken out on this home.
Original Mortgage
$110,000
Interest Rate
4.87%
Mortgage Type
Purchase Money Mortgage
Create a Home Valuation Report for This Property
The Home Valuation Report is an in-depth analysis detailing your home's value as well as a comparison with similar homes in the area
Home Values in the Area
Average Home Value in this Area
Purchase History
| Date | Buyer | Sale Price | Title Company |
|---|---|---|---|
| Kenneson Kimberly | $165,000 | -- | |
| Smith Jonathan R | -- | -- | |
| Smith Jonathan | $165,000 | -- |
Source: Public Records
Mortgage History
| Date | Status | Borrower | Loan Amount |
|---|---|---|---|
| Previous Owner | Smith Jonathan | $110,000 |
Source: Public Records
Tax History Compared to Growth
Tax History
| Year | Tax Paid | Tax Assessment Tax Assessment Total Assessment is a certain percentage of the fair market value that is determined by local assessors to be the total taxable value of land and additions on the property. | Land | Improvement |
|---|---|---|---|---|
| 2025 | $7,069 | $177,660 | $34,090 | $143,570 |
| 2024 | $7,424 | $177,660 | $34,090 | $143,570 |
| 2023 | $7,903 | $176,610 | $34,090 | $142,520 |
| 2022 | $6,609 | $138,400 | $36,060 | $102,340 |
| 2021 | $6,609 | $138,400 | $36,060 | $102,340 |
| 2020 | $6,609 | $138,400 | $36,060 | $102,340 |
| 2019 | $6,539 | $138,400 | $36,060 | $102,340 |
| 2018 | $6,273 | $129,740 | $46,120 | $83,620 |
| 2017 | $6,299 | $129,740 | $46,120 | $83,620 |
| 2016 | $6,185 | $129,740 | $46,120 | $83,620 |
| 2015 | $5,912 | $129,740 | $46,120 | $83,620 |
| 2014 | $5,846 | $129,740 | $46,120 | $83,620 |
| 2012 | $5,657 | $168,610 | $55,020 | $113,590 |
Source: Public Records
Map
Nearby Homes
- 317 City Hill St
- 142 Applewood Ln
- 51 Brook St Unit 6A
- 51 Brook St Unit 5A
- 21 Acushnet St
- 32 Stanley St
- 379 Wooster St
- 24 Windview Dr
- 190 Auburn St
- 465 N Main St
- 84 Ruela Dr
- 426 City Hill St
- 631 High St
- 32 Greenwood St
- 187 Lincoln St
- 146 Johnson St
- 3 Vine St
- 29 Ramsey Ave
- 196 N Main St
- 48 & 50 Anderson St