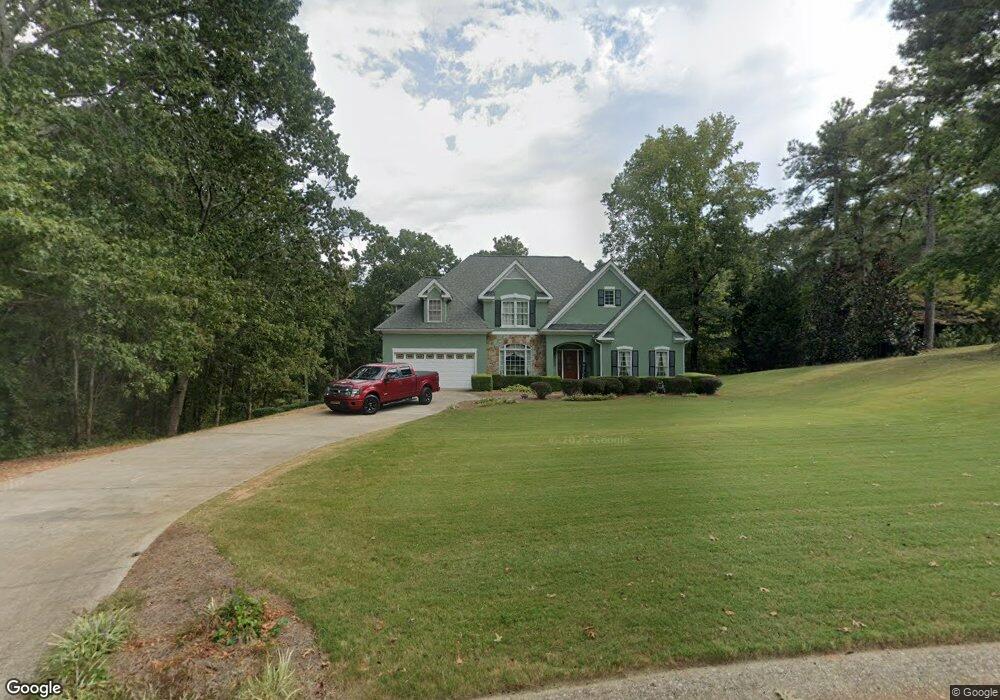
47 Logan Ridge Dr Carrollton, GA 30116
Estimated Value: $433,309 - $573,000
6
Beds
4
Baths
2,630
Sq Ft
$193/Sq Ft
Est. Value
About This Home
This home is located at 47 Logan Ridge Dr, Carrollton, GA 30116 and is currently estimated at $508,577, approximately $193 per square foot. 47 Logan Ridge Dr is a home located in Carroll County with nearby schools including Central Elementary School, Central Middle School, and Central High School.
Ownership History
Date
Name
Owned For
Owner Type
Purchase Details
Closed on
Nov 9, 2020
Sold by
Maxwell Linsey
Bought by
Maddox Thomas and Maddox Betty J
Current Estimated Value
Home Financials for this Owner
Home Financials are based on the most recent Mortgage that was taken out on this home.
Original Mortgage
$260,200
Outstanding Balance
$230,204
Interest Rate
2.8%
Mortgage Type
FHA
Estimated Equity
$278,373
Purchase Details
Closed on
Sep 27, 1998
Bought by
Logan Charles H
Purchase Details
Closed on
Mar 1, 1998
Sold by
Logan Charles H
Bought by
Maxwell Linsey
Purchase Details
Closed on
May 1, 1996
Sold by
Jackson Glen
Bought by
Venture Development
Purchase Details
Closed on
May 10, 1994
Sold by
Venture Dev
Bought by
Logan Charles H
Purchase Details
Closed on
Dec 1, 1992
Bought by
Venture Dev
Create a Home Valuation Report for This Property
The Home Valuation Report is an in-depth analysis detailing your home's value as well as a comparison with similar homes in the area
Home Values in the Area
Average Home Value in this Area
Purchase History
| Date | Buyer | Sale Price | Title Company |
|---|---|---|---|
| Maddox Thomas | $265,000 | -- | |
| Logan Charles H | -- | -- | |
| Maxwell Linsey | $14,500 | -- | |
| Venture Development | -- | -- | |
| Logan Charles H | -- | -- | |
| Venture Dev | -- | -- |
Source: Public Records
Mortgage History
| Date | Status | Borrower | Loan Amount |
|---|---|---|---|
| Open | Maddox Thomas | $260,200 |
Source: Public Records
Tax History Compared to Growth
Tax History
| Year | Tax Paid | Tax Assessment Tax Assessment Total Assessment is a certain percentage of the fair market value that is determined by local assessors to be the total taxable value of land and additions on the property. | Land | Improvement |
|---|---|---|---|---|
| 2024 | $4,360 | $216,764 | $26,280 | $190,484 |
| 2023 | $4,360 | $200,142 | $26,280 | $173,862 |
| 2022 | $3,907 | $165,943 | $26,280 | $139,663 |
| 2021 | $2,615 | $145,530 | $26,280 | $119,250 |
| 2020 | $589 | $133,584 | $26,280 | $107,304 |
| 2019 | $605 | $124,901 | $26,280 | $98,621 |
| 2018 | $635 | $113,027 | $26,280 | $86,747 |
| 2017 | $641 | $113,027 | $26,280 | $86,747 |
| 2016 | $641 | $113,027 | $26,280 | $86,747 |
| 2015 | $646 | $84,812 | $8,000 | $76,812 |
| 2014 | $652 | $84,812 | $8,000 | $76,812 |
Source: Public Records
Map
Nearby Homes
- 484 Carrie Kathleen Terrace
- 472 Carrie Kathleen Terrace
- 1915 Whooping Creek Church Rd
- 221 Valley Ridge Dr
- 0 Lowell Rd Unit 10640679
- 1512 Whooping Creek Church Rd
- 1502 Whooping Creek Church Rd
- 1450 Whooping Creek Church Rd
- 1430 Whooping Creek Church Rd
- 135 Gray Rd
- 1233 Whooping Creek Rd
- 1001 Whooping Creek Rd
- 0 Ringer Rd Unit 10595950
- 2492 Oak Grove Church Rd
- 605 Whooping Creek Rd
- 500 Coleman Mill Rd
- 35 Logan Ridge Dr
- 59 Logan Ridge Dr
- 62 Logan Ridge Dr
- 73 Logan Ridge Dr
- 15 Logan Ridge Dr
- 15 Logan Ridge Dr Unit 1
- 0 Logan Ridge Dr Unit 7080803
- 0 Logan Ridge Dr Unit 7171190
- 15 Logan
- 2115 Whooping Creek Church Rd
- 338 Valley Ridge Dr
- 86 Logan Ridge Unit 27
- 86 Logan Ridge Dr Unit 27
- 86 Logan Ridge Dr
- 87 Logan Ridge Dr
- 320 Valley Ridge Dr Unit 30
- 320 Valley Ridge Dr
- 10 Logan Ridge Dr
- 100 Logan Ridge Dr
- 101 Logan Ridge Dr