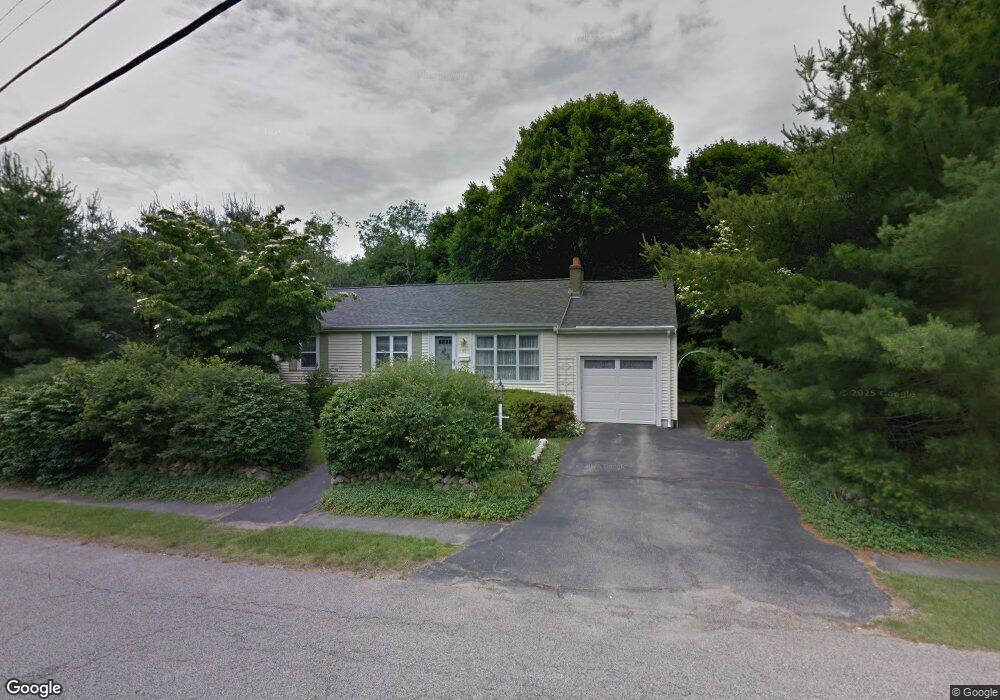
47 Marks St Rockland, MA 02370
Estimated Value: $516,679 - $598,000
Studio
1
Bath
1,170
Sq Ft
$474/Sq Ft
Est. Value
About This Home
This home is located at 47 Marks St, Rockland, MA 02370 and is currently estimated at $554,170, approximately $473 per square foot. 47 Marks St is a home located in Plymouth County with nearby schools including Rockland Senior High School, Calvary Chapel Academy, and Holy Family Elementary School.
Ownership History
Date
Name
Owned For
Owner Type
Purchase Details
Closed on
Jun 9, 1995
Sold by
Anderson Donald P
Bought by
Chekoulias Judith A
Current Estimated Value
Home Financials for this Owner
Home Financials are based on the most recent Mortgage that was taken out on this home.
Original Mortgage
$102,000
Interest Rate
8.21%
Mortgage Type
Purchase Money Mortgage
Create a Home Valuation Report for This Property
The Home Valuation Report is an in-depth analysis detailing your home's value as well as a comparison with similar homes in the area
Home Values in the Area
Average Home Value in this Area
Purchase History
| Date | Buyer | Sale Price | Title Company |
|---|---|---|---|
| Chekoulias Judith A | $127,500 | -- |
Source: Public Records
Mortgage History
| Date | Status | Borrower | Loan Amount |
|---|---|---|---|
| Closed | Chekoulias Judith A | $102,000 |
Source: Public Records
Tax History
| Year | Tax Paid | Tax Assessment Tax Assessment Total Assessment is a certain percentage of the fair market value that is determined by local assessors to be the total taxable value of land and additions on the property. | Land | Improvement |
|---|---|---|---|---|
| 2025 | $6,486 | $474,500 | $228,500 | $246,000 |
| 2024 | $6,295 | $447,700 | $215,500 | $232,200 |
| 2023 | $6,254 | $410,900 | $197,700 | $213,200 |
| 2022 | $6,028 | $359,900 | $171,900 | $188,000 |
| 2021 | $6,045 | $321,000 | $156,300 | $164,700 |
| 2020 | $5,352 | $305,800 | $148,900 | $156,900 |
| 2019 | $5,224 | $291,500 | $141,800 | $149,700 |
| 2018 | $4,852 | $266,300 | $141,800 | $124,500 |
| 2017 | $4,714 | $255,100 | $141,800 | $113,300 |
| 2016 | $4,536 | $245,300 | $136,300 | $109,000 |
| 2015 | $4,335 | $227,800 | $127,400 | $100,400 |
| 2014 | $3,884 | $211,800 | $125,000 | $86,800 |
Source: Public Records
Map
Nearby Homes
- 206-208 Hinghm St
- 117 Liberty St
- 63 Webster St
- 26 Hobart Ln Unit 26,C
- 1 Von Rhor Dr Unit 1
- 48 Bigelow Ave
- 36 Bayberry Ln
- 9 Old Market St
- 40 Summit St
- 12 Dyer St Unit 12
- 19 Dyer St Unit 19
- 50 Linden Park
- 737-739 Union St
- 215 Market St
- 823 Market St
- 3 Leslie Ct
- 1 Canterbury Ln
- 7 Boxberry Ln Unit 7
- 6 Chestnut Cir
- 9 Juniper Cir
Your Personal Tour Guide
Ask me questions while you tour the home.