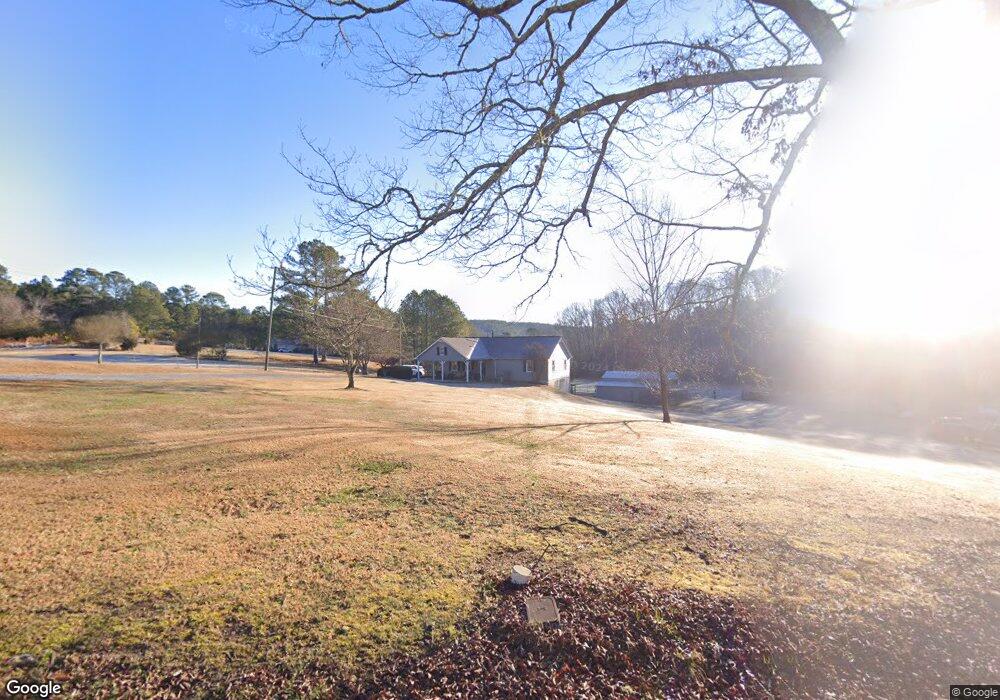
47 McBurnett Rd SE Silver Creek, GA 30173
Estimated Value: $278,000 - $537,139
--
Bed
--
Bath
2,104
Sq Ft
$179/Sq Ft
Est. Value
About This Home
This home is located at 47 McBurnett Rd SE, Silver Creek, GA 30173 and is currently estimated at $377,535, approximately $179 per square foot. 47 McBurnett Rd SE is a home located in Floyd County with nearby schools including Pepperell Middle School and Pepperell High School.
Ownership History
Date
Name
Owned For
Owner Type
Purchase Details
Closed on
Apr 26, 2006
Sold by
Not Provided
Bought by
Chandler Chandler Tabitha C Tabitha C and Chandler Jeffrey S
Current Estimated Value
Home Financials for this Owner
Home Financials are based on the most recent Mortgage that was taken out on this home.
Original Mortgage
$30,000
Interest Rate
6%
Mortgage Type
New Conventional
Purchase Details
Closed on
Dec 22, 2003
Sold by
Hogan Robert Tim
Bought by
Chandler Jeffrey S and Chan Tabitha C
Purchase Details
Closed on
Mar 9, 2001
Bought by
P and R
Purchase Details
Closed on
Jun 9, 2000
Sold by
Cleveland Pat R & L Sue Cleveland
Bought by
Hogan Robert Tim
Purchase Details
Closed on
Nov 25, 1994
Sold by
Toles Temple & Wright Inc & Tim Wallis
Bought by
Cleveland Pat R & L Sue Cleveland
Purchase Details
Closed on
Sep 1, 1994
Bought by
Toles Temple & Wright Inc & Tim Wallis
Create a Home Valuation Report for This Property
The Home Valuation Report is an in-depth analysis detailing your home's value as well as a comparison with similar homes in the area
Home Values in the Area
Average Home Value in this Area
Purchase History
| Date | Buyer | Sale Price | Title Company |
|---|---|---|---|
| Chandler Chandler Tabitha C Tabitha C | -- | -- | |
| Chandler Chandler Tabitha C Tabitha C | -- | -- | |
| Chandler Jeffrey S | $167,900 | -- | |
| P | -- | -- | |
| Hogan Robert Tim | $130,000 | -- | |
| Cleveland Pat R & L Sue Cleveland | $45,000 | -- | |
| Toles Temple & Wright Inc & Tim Wallis | $37,800 | -- |
Source: Public Records
Mortgage History
| Date | Status | Borrower | Loan Amount |
|---|---|---|---|
| Closed | Chandler Chandler Tabitha C Tabitha C | $30,000 |
Source: Public Records
Tax History Compared to Growth
Tax History
| Year | Tax Paid | Tax Assessment Tax Assessment Total Assessment is a certain percentage of the fair market value that is determined by local assessors to be the total taxable value of land and additions on the property. | Land | Improvement |
|---|---|---|---|---|
| 2024 | $4,191 | $177,471 | $53,587 | $123,884 |
| 2023 | $4,074 | $148,366 | $48,715 | $99,651 |
| 2022 | $3,221 | $127,138 | $40,047 | $87,091 |
| 2021 | $2,886 | $107,672 | $36,150 | $71,522 |
| 2020 | $2,546 | $90,124 | $31,436 | $58,688 |
| 2019 | $2,466 | $87,433 | $31,436 | $55,997 |
| 2018 | $2,379 | $83,125 | $29,943 | $53,182 |
| 2017 | $2,304 | $79,640 | $27,972 | $51,668 |
| 2016 | $2,262 | $77,305 | $27,960 | $49,345 |
| 2015 | $2,214 | $77,305 | $27,960 | $49,345 |
| 2014 | $2,214 | $77,305 | $27,960 | $49,345 |
Source: Public Records
Map
Nearby Homes
- 1850 Pleasant Valley Rd SE
- 29 Crossridge Dr SE
- 14 Crossridge Dr SE
- 300 Ellis Rd SE
- Greenbriar Plan at Three Rivers - Maple Street Collection
- Jensen Plan at Three Rivers - Maple Street Collection
- Yosemite Plan at Three Rivers - Maple Street Collection
- Danville Plan at Three Rivers - Maple Street Collection
- Breckenridge Plan at Three Rivers - Maple Street Collection
- Beacon Plan at Three Rivers - Maple Street Collection
- Wesley Plan at Three Rivers - Maple Street Collection
- DaVinci Plan at Three Rivers - Maple Street Collection
- Yosemite Plan at Cherry Glen - Maple Street Collection
- Jensen Plan at Cherry Glen - Maple Street Collection
- Breckenridge Plan at Cherry Glen - Maple Street Collection
- Greenbriar Plan at Cherry Glen - Maple Street Collection
- Wesley Plan at Cherry Glen - Maple Street Collection
- DaVinci Plan at Cherry Glen - Maple Street Collection
- Beacon Plan at Cherry Glen - Maple Street Collection
- 9 Woodberry Dr SE
- 27 McBurnett Rd SE
- 61 McBurnett Rd SE
- 0 McBurnett Rd Unit 7412085
- 0 McBurnett Rd Unit 7584355
- 31 McBurnett Rd SE
- 773 Preacher Smith Rd SE
- 804 Preacher Smith Rd SE
- 794 Preacher Smith Rd SE
- 110 McBurnett Rd SE
- 797 Preacher Smith Rd SE
- 807 Preacher Smith Rd SE
- 814 Preacher Smith Rd SE
- 103 McBurnett Rd SE
- 817 Preacher Smith Rd SE
- 822 Preacher Smith Rd SE
- 838 Preacher Smith Rd SE
- 847 Preacher Smith Rd SE
- 832 Pleasant Valley Rd SE
- 790 Pleasant Valley Rd SE
- 11 Misty Ridge Dr SE