47 Montclair Rd Waban, MA 02468
Waban NeighborhoodEstimated Value: $3,551,000 - $5,790,000
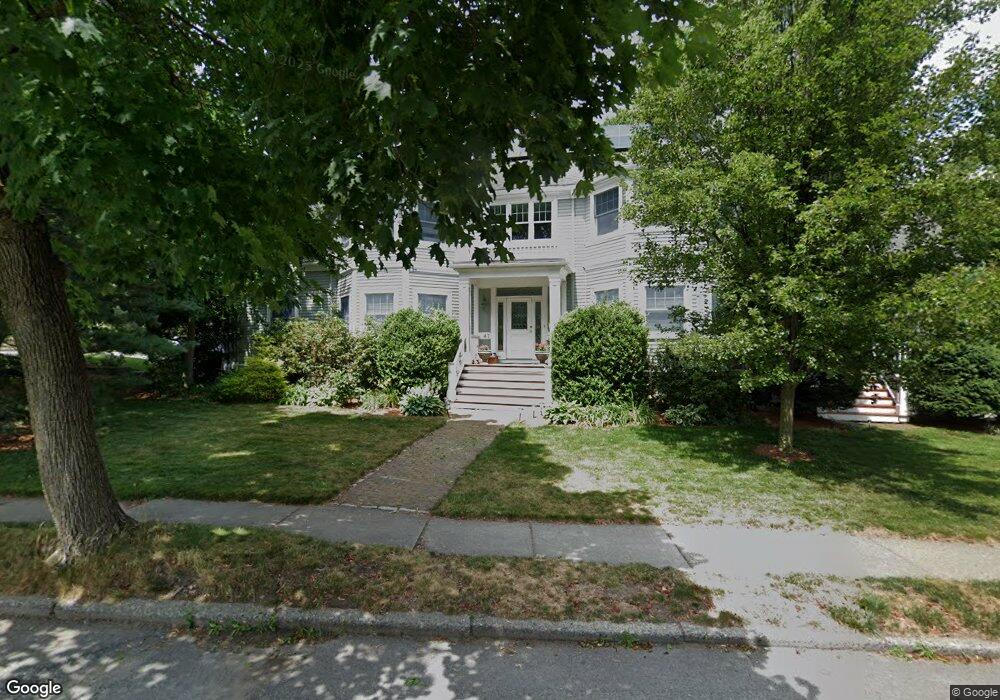
About This Home
This home is located at 47 Montclair Rd, Waban, MA 02468 and is currently estimated at $4,451,399, approximately $1,079 per square foot. 47 Montclair Rd is a home located in Middlesex County with nearby schools including Angier Elementary School, Charles E Brown Middle School, and Newton South High School.
Ownership History
We collect this data history from publicly available records. To have your information removed, we recommend requesting removal directly through your county’s website.
Purchase Details
Purchase Details
Purchase Details
Home Values in the Area
Average Home Value in this Area
Purchase History
We collect this data history from publicly available records. To have your information removed, we recommend requesting removal directly through your county’s website.
| Date | Buyer | Sale Price | Title Company |
|---|---|---|---|
| $1,900,000 | -- | ||
| $450,000 | -- | ||
| $350,000 | -- |
Mortgage History
We collect this data history from publicly available records. To have your information removed, we recommend requesting removal directly through your county’s website.
| Date | Status | Borrower | Loan Amount |
|---|---|---|---|
| Open | $275,000 |
Tax History
We collect this data history from publicly available records. To have your information removed, we recommend requesting removal directly through your county’s website.
| Year | Tax Paid | Tax Assessment Tax Assessment Total Assessment is a certain percentage of the fair market value that is determined by local assessors to be the total taxable value of land and additions on the property. | Land | Improvement |
|---|---|---|---|---|
| 2025 | $39,919 | $4,073,400 | $1,266,300 | $2,807,100 |
| 2024 | $38,599 | $3,954,800 | $1,229,400 | $2,725,400 |
| 2023 | $37,433 | $3,677,100 | $956,100 | $2,721,000 |
| 2022 | $35,817 | $3,404,700 | $885,300 | $2,519,400 |
| 2021 | $34,561 | $3,212,000 | $835,200 | $2,376,800 |
| 2020 | $33,533 | $3,212,000 | $835,200 | $2,376,800 |
| 2019 | $32,587 | $3,118,400 | $810,900 | $2,307,500 |
| 2018 | $31,613 | $2,921,700 | $732,600 | $2,189,100 |
| 2017 | $30,785 | $2,768,400 | $691,100 | $2,077,300 |
| 2016 | $29,443 | $2,587,300 | $645,900 | $1,941,400 |
| 2015 | $28,073 | $2,418,000 | $603,600 | $1,814,400 |
Map
- 1580 Beacon St
- 151 Pine Ridge Rd
- 240 Windsor Rd
- 458 Woodward St
- 29 Gammons Rd
- 148 Dartmouth St
- 443 Chestnut St
- 14 Homestead St
- 19 Bonnybrook Rd
- 18 Annawan Rd
- 17 Woodhaven Rd
- 11 Woodhaven Rd
- 35 Metacomet Rd
- 34 Pilgrim Rd
- 215 Dorset Rd
- 50 Gould Rd
- 28 York Rd
- 1640 Commonwealth Ave
- 470 Quinobequin Rd
- 79 Longfellow Rd
Ask me questions while you tour the home.