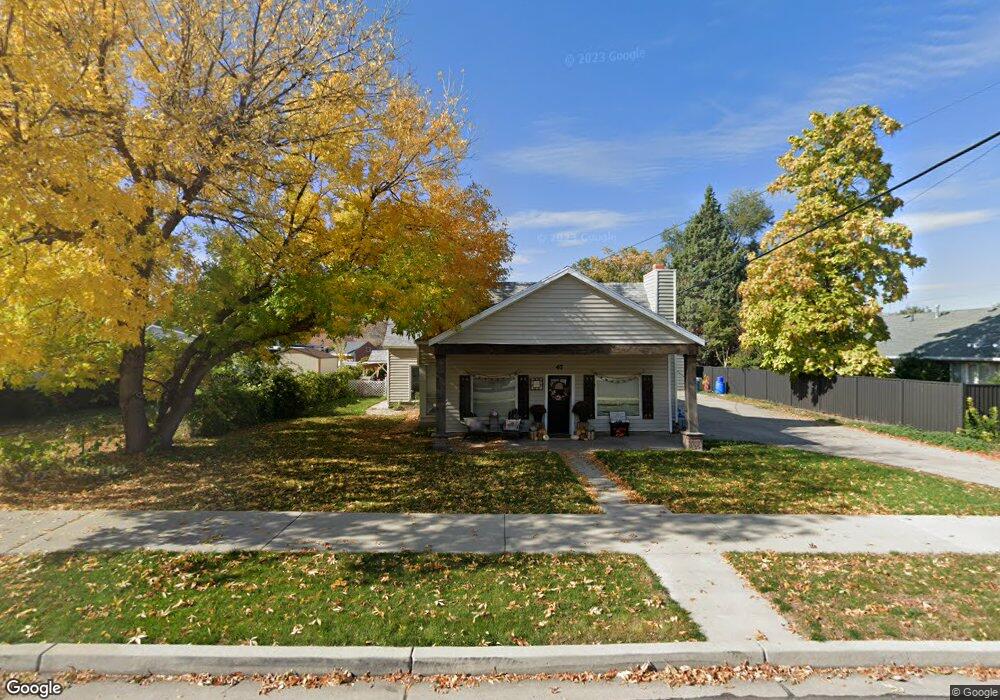
47 N 200 W Payson, UT 84651
Estimated Value: $400,092 - $435,000
3
Beds
2
Baths
2,017
Sq Ft
$210/Sq Ft
Est. Value
About This Home
This home is located at 47 N 200 W, Payson, UT 84651 and is currently estimated at $423,031, approximately $209 per square foot. 47 N 200 W is a home located in Utah County with nearby schools including Taylor Elementary School, Salem Junior High School, and Valley View Middle School.
Ownership History
Date
Name
Owned For
Owner Type
Purchase Details
Closed on
May 28, 2020
Sold by
Beaumont Christian L and Eastman Ashtin S
Bought by
Bills Tanner James
Current Estimated Value
Home Financials for this Owner
Home Financials are based on the most recent Mortgage that was taken out on this home.
Original Mortgage
$243,380
Outstanding Balance
$216,140
Interest Rate
3.3%
Mortgage Type
New Conventional
Estimated Equity
$206,891
Purchase Details
Closed on
Feb 12, 2018
Sold by
Brook Rindlisbacher Carol Lavon and The Lavon T Brook Family Trust
Bought by
Beaumont Christian I and Eastman Ashtin S
Home Financials for this Owner
Home Financials are based on the most recent Mortgage that was taken out on this home.
Original Mortgage
$186,111
Interest Rate
3.99%
Mortgage Type
New Conventional
Create a Home Valuation Report for This Property
The Home Valuation Report is an in-depth analysis detailing your home's value as well as a comparison with similar homes in the area
Home Values in the Area
Average Home Value in this Area
Purchase History
| Date | Buyer | Sale Price | Title Company |
|---|---|---|---|
| Bills Tanner James | -- | Investors Title Ins Agcy | |
| Beaumont Christian I | -- | Inwest Title |
Source: Public Records
Mortgage History
| Date | Status | Borrower | Loan Amount |
|---|---|---|---|
| Open | Bills Tanner James | $243,380 | |
| Previous Owner | Beaumont Christian I | $186,111 |
Source: Public Records
Tax History
| Year | Tax Paid | Tax Assessment Tax Assessment Total Assessment is a certain percentage of the fair market value that is determined by local assessors to be the total taxable value of land and additions on the property. | Land | Improvement |
|---|---|---|---|---|
| 2025 | $2,028 | $202,235 | -- | -- |
| 2024 | $2,028 | $206,415 | $0 | $0 |
| 2023 | $2,092 | $213,510 | $0 | $0 |
| 2022 | $1,970 | $197,780 | $0 | $0 |
| 2021 | $1,675 | $269,700 | $89,500 | $180,200 |
| 2020 | $1,556 | $245,000 | $77,800 | $167,200 |
| 2019 | $1,334 | $215,400 | $70,000 | $145,400 |
| 2018 | $1,192 | $185,500 | $59,100 | $126,400 |
| 2017 | $1,090 | $91,245 | $0 | $0 |
| 2016 | $988 | $82,115 | $0 | $0 |
| 2015 | $882 | $72,875 | $0 | $0 |
| 2014 | $850 | $70,730 | $0 | $0 |
Source: Public Records
Map
Nearby Homes
- 215 W 100 N
- 217 W 100 N
- 213 W 100 N
- 208 W Utah Ave
- 298 W Utah Ave
- 273 W 100 N
- 300 W Utah Ave
- 273 W 100 N
- 293 W 100 N
- 196 W Utah Ave
- 3 S 300 W Unit 3
- 320 W Utah Ave
- 5 S 300 W Unit 5
- 7 S 300 W Unit 7
- 9 S 300 W Unit 9
- 11 S 300 W Unit 11
- 50 N 200 W
- 13 S 300 W Unit 13
- 15 S 300 W Unit 15
- 17 S 300 W Unit 17
Your Personal Tour Guide
Ask me questions while you tour the home.