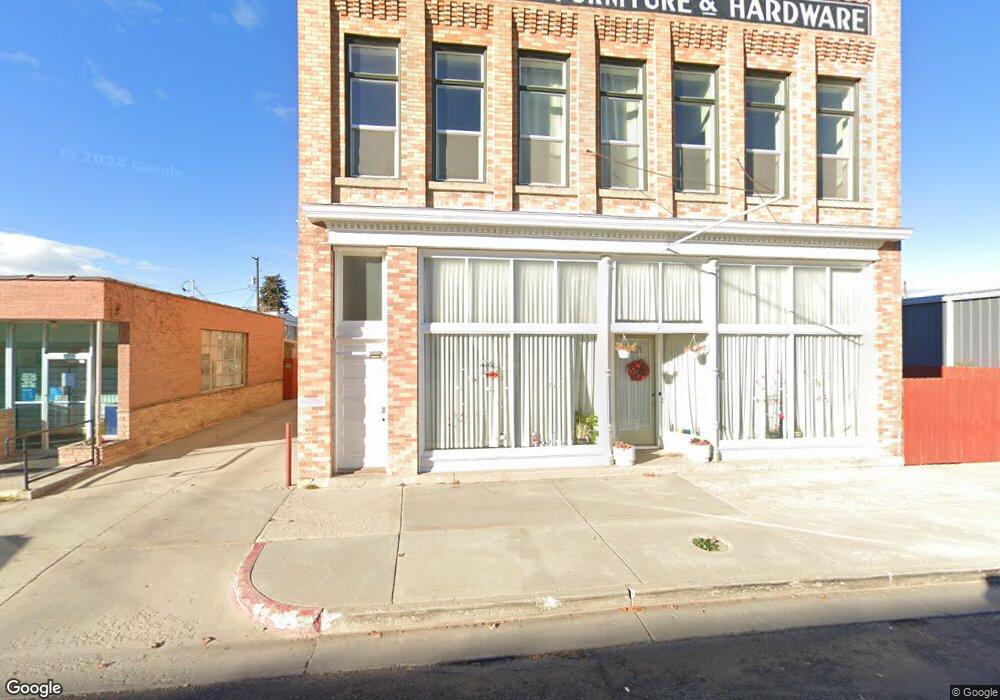
47 N Main St Unit 1 Garland, UT 84312
Estimated Value: $436,000 - $807,000
2
Beds
4
Baths
800
Sq Ft
$798/Sq Ft
Est. Value
About This Home
This home is located at 47 N Main St Unit 1, Garland, UT 84312 and is currently estimated at $638,414, approximately $798 per square foot. 47 N Main St Unit 1 is a home located in Box Elder County with nearby schools including Fielding School, Bear River Middle School, and Alice C. Harris Intermediate School.
Ownership History
Date
Name
Owned For
Owner Type
Purchase Details
Closed on
May 23, 2025
Sold by
Whitfield Judy
Bought by
Whitfield Judy and Whitfield Sara
Current Estimated Value
Home Financials for this Owner
Home Financials are based on the most recent Mortgage that was taken out on this home.
Original Mortgage
$455,000
Outstanding Balance
$453,379
Interest Rate
6.62%
Mortgage Type
New Conventional
Estimated Equity
$185,035
Purchase Details
Closed on
May 22, 2025
Sold by
Francom Daniel H and Francom Jennifer S
Bought by
Whitfield Judy
Home Financials for this Owner
Home Financials are based on the most recent Mortgage that was taken out on this home.
Original Mortgage
$455,000
Outstanding Balance
$453,379
Interest Rate
6.62%
Mortgage Type
New Conventional
Estimated Equity
$185,035
Purchase Details
Closed on
Dec 15, 2014
Sold by
Skip Skip
Bought by
Skip Skip
Create a Home Valuation Report for This Property
The Home Valuation Report is an in-depth analysis detailing your home's value as well as a comparison with similar homes in the area
Home Values in the Area
Average Home Value in this Area
Purchase History
| Date | Buyer | Sale Price | Title Company |
|---|---|---|---|
| Whitfield Judy | -- | Us Title | |
| Whitfield Judy | -- | None Listed On Document | |
| Whitfield Judy | -- | None Listed On Document | |
| Skip Skip | $124,000 | Northern Title Company |
Source: Public Records
Mortgage History
| Date | Status | Borrower | Loan Amount |
|---|---|---|---|
| Open | Whitfield Judy | $455,000 | |
| Closed | Whitfield Judy | $455,000 |
Source: Public Records
Tax History Compared to Growth
Tax History
| Year | Tax Paid | Tax Assessment Tax Assessment Total Assessment is a certain percentage of the fair market value that is determined by local assessors to be the total taxable value of land and additions on the property. | Land | Improvement |
|---|---|---|---|---|
| 2025 | $2,890 | $477,289 | $105,000 | $372,289 |
| 2024 | $2,890 | $475,180 | $100,000 | $375,180 |
| 2023 | $1,764 | $298,696 | $90,000 | $208,696 |
| 2022 | $1,472 | $233,696 | $25,000 | $208,696 |
| 2021 | $1,619 | $233,696 | $25,000 | $208,696 |
| 2020 | $1,681 | $233,696 | $25,000 | $208,696 |
| 2019 | $1,744 | $128,533 | $13,750 | $114,783 |
| 2018 | $1,258 | $86,657 | $13,338 | $73,319 |
| 2017 | $1,306 | $157,558 | $13,338 | $133,308 |
| 2016 | $1,233 | $83,166 | $13,338 | $69,828 |
| 2015 | $1,144 | $76,818 | $13,338 | $63,480 |
| 2014 | $1,144 | $73,795 | $13,338 | $60,457 |
| 2013 | -- | $73,795 | $13,338 | $60,457 |
Source: Public Records
Map
Nearby Homes