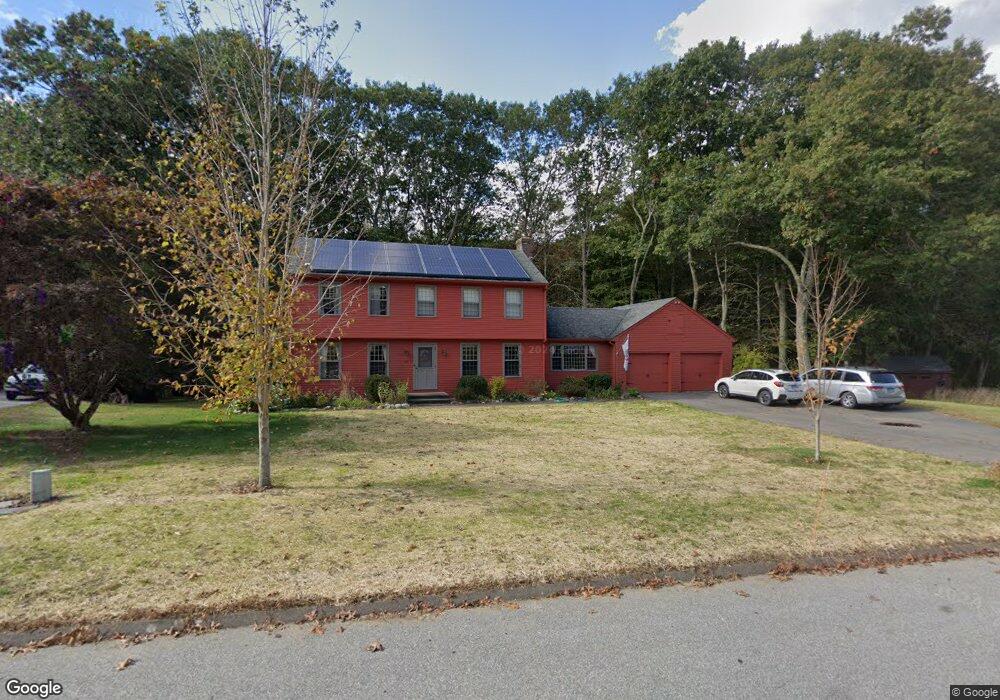
47 N Maple St East Hampton, CT 06424
Estimated Value: $464,831 - $566,000
3
Beds
3
Baths
2,142
Sq Ft
$246/Sq Ft
Est. Value
About This Home
This home is located at 47 N Maple St, East Hampton, CT 06424 and is currently estimated at $527,208, approximately $246 per square foot. 47 N Maple St is a home located in Middlesex County with nearby schools including Memorial School, Center Elementary School, and East Hampton Middle School.
Ownership History
Date
Name
Owned For
Owner Type
Purchase Details
Closed on
Jan 23, 2007
Sold by
Turner Diane L
Bought by
Wilson Joshua and Wilson Emily
Current Estimated Value
Home Financials for this Owner
Home Financials are based on the most recent Mortgage that was taken out on this home.
Original Mortgage
$284,000
Interest Rate
6.14%
Purchase Details
Closed on
Jun 20, 1995
Sold by
Coolidge John E and Coolidge Maureen
Bought by
Turner Edward C and Turner Diane L
Purchase Details
Closed on
Mar 30, 1990
Sold by
Rand Inv Inc
Bought by
Coolidge John E
Create a Home Valuation Report for This Property
The Home Valuation Report is an in-depth analysis detailing your home's value as well as a comparison with similar homes in the area
Home Values in the Area
Average Home Value in this Area
Purchase History
| Date | Buyer | Sale Price | Title Company |
|---|---|---|---|
| Wilson Joshua | $355,000 | -- | |
| Wilson Joshua | $355,000 | -- | |
| Turner Edward C | $199,900 | -- | |
| Turner Edward C | $199,900 | -- | |
| Coolidge John E | $233,700 | -- |
Source: Public Records
Mortgage History
| Date | Status | Borrower | Loan Amount |
|---|---|---|---|
| Open | Coolidge John E | $279,000 | |
| Closed | Coolidge John E | $284,000 |
Source: Public Records
Tax History
| Year | Tax Paid | Tax Assessment Tax Assessment Total Assessment is a certain percentage of the fair market value that is determined by local assessors to be the total taxable value of land and additions on the property. | Land | Improvement |
|---|---|---|---|---|
| 2025 | $7,372 | $185,650 | $46,210 | $139,440 |
| 2024 | $7,062 | $185,650 | $46,210 | $139,440 |
| 2023 | $6,695 | $185,650 | $46,210 | $139,440 |
| 2022 | $6,435 | $185,650 | $46,210 | $139,440 |
| 2021 | $6,410 | $185,650 | $46,210 | $139,440 |
| 2020 | $6,182 | $186,530 | $43,620 | $142,910 |
| 2019 | $6,420 | $193,730 | $44,730 | $149,000 |
| 2018 | $6,068 | $193,730 | $44,730 | $149,000 |
| 2017 | $6,068 | $193,730 | $44,730 | $149,000 |
| 2016 | $5,703 | $193,730 | $44,730 | $149,000 |
| 2015 | $5,258 | $189,290 | $43,210 | $146,080 |
| 2014 | $4,575 | $189,290 | $43,210 | $146,080 |
Source: Public Records
Map
Nearby Homes
Your Personal Tour Guide
Ask me questions while you tour the home.