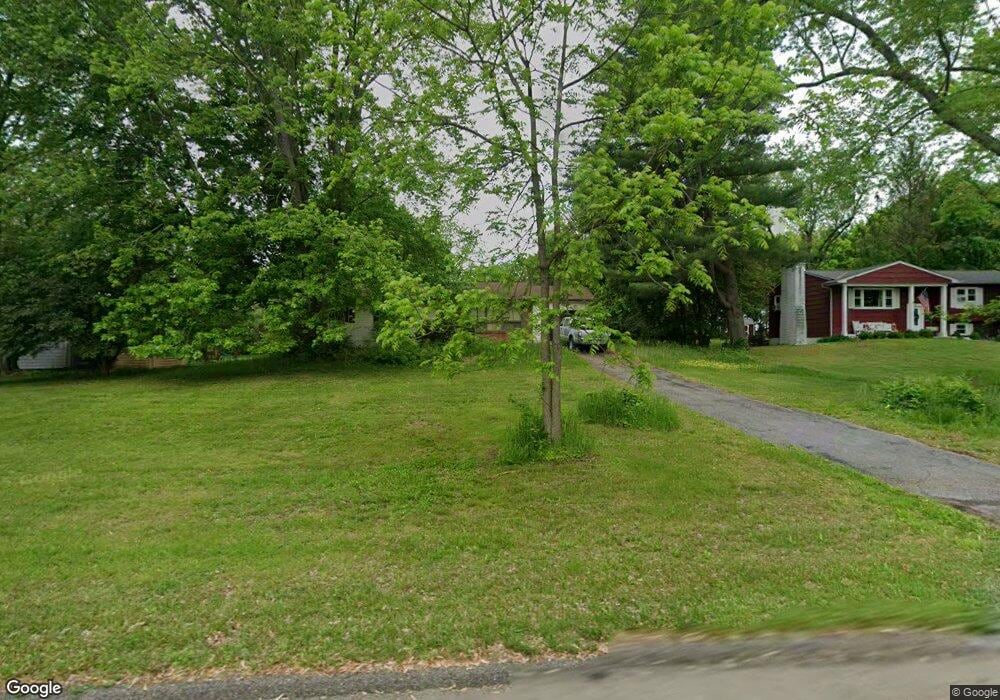
47 Ninham Ave Wappingers Falls, NY 12590
Estimated Value: $441,000 - $463,000
3
Beds
1
Bath
1,222
Sq Ft
$371/Sq Ft
Est. Value
About This Home
This home is located at 47 Ninham Ave, Wappingers Falls, NY 12590 and is currently estimated at $452,931, approximately $370 per square foot. 47 Ninham Ave is a home located in Dutchess County with nearby schools including Myers Corners Elementary School, Van Wyck Junior High School, and John Jay Senior High School.
Ownership History
Date
Name
Owned For
Owner Type
Purchase Details
Closed on
Jun 26, 2009
Sold by
Sandy Anthony
Bought by
Sandy Anthony
Current Estimated Value
Home Financials for this Owner
Home Financials are based on the most recent Mortgage that was taken out on this home.
Original Mortgage
$116,000
Outstanding Balance
$41,515
Interest Rate
5.31%
Mortgage Type
Purchase Money Mortgage
Estimated Equity
$411,416
Purchase Details
Closed on
Dec 3, 2002
Sold by
Horn Joan B
Bought by
Sandy Anthony J
Create a Home Valuation Report for This Property
The Home Valuation Report is an in-depth analysis detailing your home's value as well as a comparison with similar homes in the area
Home Values in the Area
Average Home Value in this Area
Purchase History
| Date | Buyer | Sale Price | Title Company |
|---|---|---|---|
| Sandy Anthony | -- | -- | |
| Sandy Anthony J | $238,500 | Richard Corbally |
Source: Public Records
Mortgage History
| Date | Status | Borrower | Loan Amount |
|---|---|---|---|
| Open | Sandy Anthony | $116,000 |
Source: Public Records
Tax History Compared to Growth
Tax History
| Year | Tax Paid | Tax Assessment Tax Assessment Total Assessment is a certain percentage of the fair market value that is determined by local assessors to be the total taxable value of land and additions on the property. | Land | Improvement |
|---|---|---|---|---|
| 2024 | $7,400 | $386,300 | $63,000 | $323,300 |
| 2023 | $9,600 | $364,300 | $63,000 | $301,300 |
| 2019 | $6,206 | $273,800 | $63,000 | $210,800 |
Source: Public Records
Map
Nearby Homes
- 26 Tiger Rd
- 20 Tiger Rd
- 271A All Angels Hill Rd
- 565 Old Hopewell Rd
- 89 Brown Rd
- 26 Scott Dr
- 37 Scott Dr
- 10 Helin Rd
- 23 Marcella Blvd
- 116 Edgehill Dr
- 50 Scott Dr
- 634 Route 82
- 11 Appleblossom Ln
- 21 Russo Dr
- 78 Edgehill Dr
- 45 Tina Ln
- 32 Elizabeth Dr
- 11 Boxwood Close
- 0 All Angels Hill Rd Unit R1655379
- 77 Brothers Rd