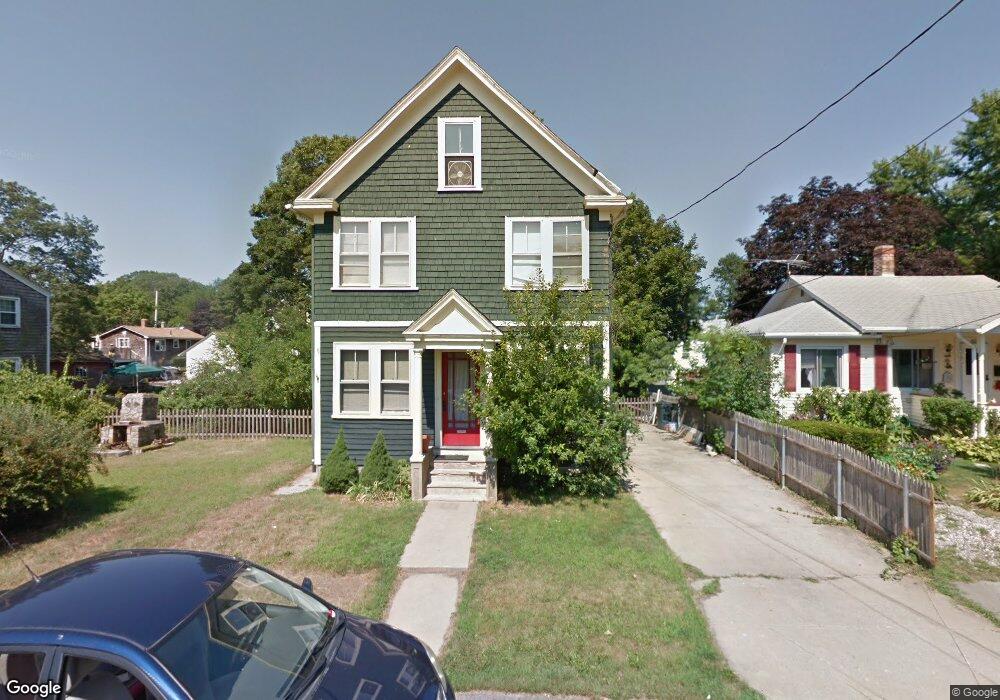
47 Peck Ave Riverside, RI 02915
Riverside NeighborhoodEstimated Value: $426,000 - $497,000
4
Beds
1
Bath
1,532
Sq Ft
$303/Sq Ft
Est. Value
About This Home
This home is located at 47 Peck Ave, Riverside, RI 02915 and is currently estimated at $463,787, approximately $302 per square foot. 47 Peck Ave is a home located in Providence County with nearby schools including East Providence High School, St Luke Elementary School, and Barrington Christian Academy.
Ownership History
Date
Name
Owned For
Owner Type
Purchase Details
Closed on
Jul 18, 2007
Sold by
Silver Lining Corp
Bought by
Moers Dennis R
Current Estimated Value
Home Financials for this Owner
Home Financials are based on the most recent Mortgage that was taken out on this home.
Original Mortgage
$190,400
Interest Rate
6.54%
Mortgage Type
Purchase Money Mortgage
Purchase Details
Closed on
Oct 17, 1991
Sold by
Wosko Evelyn E
Bought by
Cary Sandra M
Create a Home Valuation Report for This Property
The Home Valuation Report is an in-depth analysis detailing your home's value as well as a comparison with similar homes in the area
Home Values in the Area
Average Home Value in this Area
Purchase History
| Date | Buyer | Sale Price | Title Company |
|---|---|---|---|
| Moers Dennis R | $238,000 | -- | |
| Cary Sandra M | $73,500 | -- | |
| Moers Dennis R | $238,000 | -- | |
| Cary Sandra M | $73,500 | -- |
Source: Public Records
Mortgage History
| Date | Status | Borrower | Loan Amount |
|---|---|---|---|
| Open | Cary Sandra M | $182,000 | |
| Closed | Cary Sandra M | $190,400 |
Source: Public Records
Tax History
| Year | Tax Paid | Tax Assessment Tax Assessment Total Assessment is a certain percentage of the fair market value that is determined by local assessors to be the total taxable value of land and additions on the property. | Land | Improvement |
|---|---|---|---|---|
| 2025 | $4,861 | $371,900 | $82,800 | $289,100 |
| 2024 | $4,151 | $270,800 | $69,100 | $201,700 |
| 2023 | $3,997 | $270,800 | $69,100 | $201,700 |
| 2022 | $3,856 | $176,400 | $37,500 | $138,900 |
| 2021 | $3,793 | $176,400 | $37,500 | $138,900 |
| 2020 | $3,632 | $176,400 | $37,500 | $138,900 |
| 2019 | $3,532 | $176,400 | $37,500 | $138,900 |
| 2018 | $3,720 | $162,600 | $40,100 | $122,500 |
| 2017 | $3,637 | $162,600 | $40,100 | $122,500 |
| 2016 | $3,619 | $162,600 | $40,100 | $122,500 |
| 2015 | $3,493 | $152,200 | $37,100 | $115,100 |
| 2014 | $3,493 | $152,200 | $37,100 | $115,100 |
Source: Public Records
Map
Nearby Homes