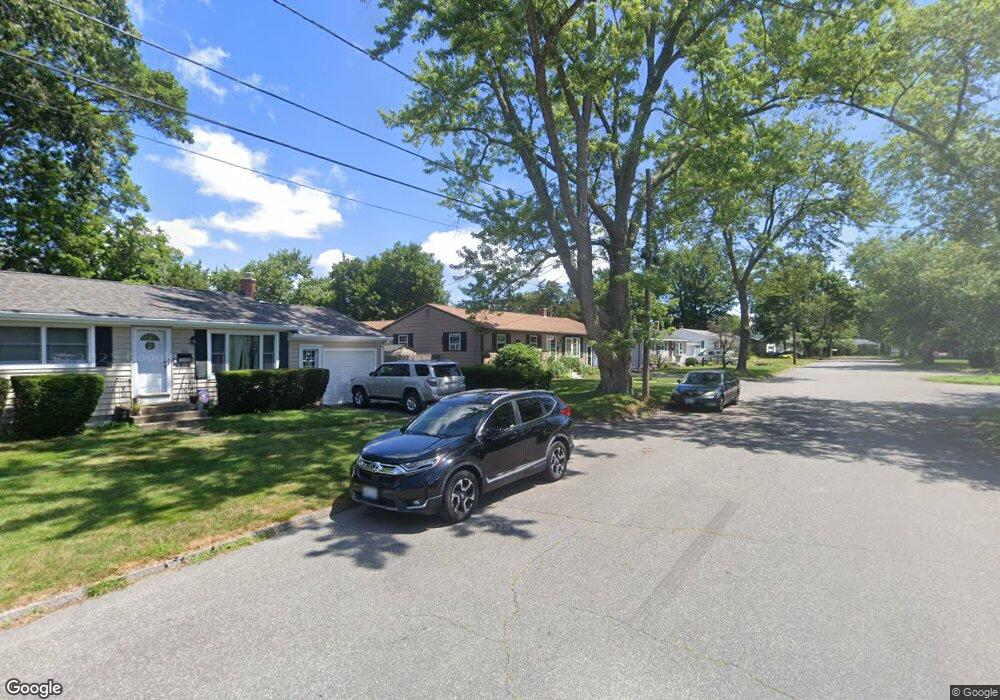
47 Perkins St Warwick, RI 02886
Hillsgrove NeighborhoodEstimated Value: $397,942 - $440,000
4
Beds
2
Baths
1,376
Sq Ft
$303/Sq Ft
Est. Value
About This Home
This home is located at 47 Perkins St, Warwick, RI 02886 and is currently estimated at $417,486, approximately $303 per square foot. 47 Perkins St is a home located in Kent County with nearby schools including St Rose Of Lima School.
Ownership History
Date
Name
Owned For
Owner Type
Purchase Details
Closed on
Jan 22, 2016
Sold by
Sloan Michael C and Sloan Christine
Bought by
Sloan Michael C and Hart Amanda
Current Estimated Value
Purchase Details
Closed on
Feb 16, 1996
Sold by
Citizens Sb
Bought by
Sloan Michael C and Sloan Christine
Home Financials for this Owner
Home Financials are based on the most recent Mortgage that was taken out on this home.
Original Mortgage
$69,900
Interest Rate
6.99%
Mortgage Type
Purchase Money Mortgage
Create a Home Valuation Report for This Property
The Home Valuation Report is an in-depth analysis detailing your home's value as well as a comparison with similar homes in the area
Home Values in the Area
Average Home Value in this Area
Purchase History
| Date | Buyer | Sale Price | Title Company |
|---|---|---|---|
| Sloan Michael C | -- | -- | |
| Sloan Michael C | $89,000 | -- |
Source: Public Records
Mortgage History
| Date | Status | Borrower | Loan Amount |
|---|---|---|---|
| Previous Owner | Sloan Michael C | $20,000 | |
| Previous Owner | Sloan Michael C | $69,900 |
Source: Public Records
Tax History
| Year | Tax Paid | Tax Assessment Tax Assessment Total Assessment is a certain percentage of the fair market value that is determined by local assessors to be the total taxable value of land and additions on the property. | Land | Improvement |
|---|---|---|---|---|
| 2025 | $4,616 | $363,500 | $102,400 | $261,100 |
| 2024 | $4,154 | $287,100 | $84,600 | $202,500 |
| 2023 | $4,074 | $287,100 | $84,600 | $202,500 |
| 2022 | $3,871 | $206,700 | $54,500 | $152,200 |
| 2021 | $3,871 | $206,700 | $54,500 | $152,200 |
| 2020 | $3,871 | $206,700 | $54,500 | $152,200 |
| 2019 | $3,871 | $206,700 | $54,500 | $152,200 |
| 2018 | $3,214 | $154,500 | $46,100 | $108,400 |
| 2017 | $3,127 | $154,500 | $46,100 | $108,400 |
| 2016 | $3,127 | $154,500 | $46,100 | $108,400 |
| 2015 | $3,081 | $148,500 | $56,400 | $92,100 |
| 2014 | $2,979 | $148,500 | $56,400 | $92,100 |
| 2013 | $2,939 | $148,500 | $56,400 | $92,100 |
Source: Public Records
Map
Nearby Homes
Your Personal Tour Guide
Ask me questions while you tour the home.