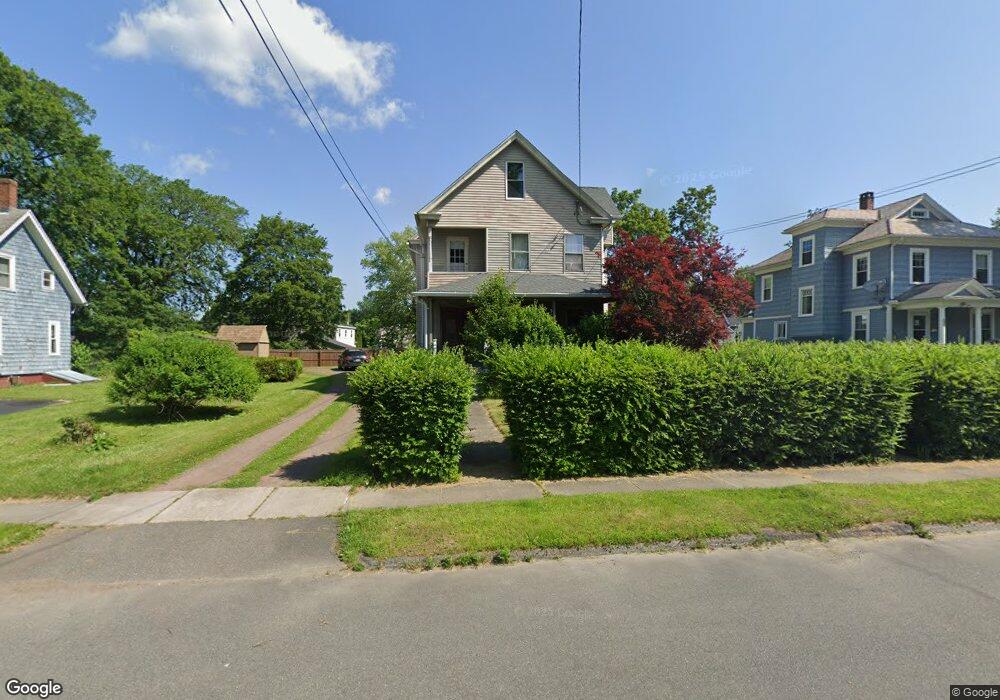
47 Phillips St Greenfield, MA 01301
Estimated Value: $303,000 - $334,000
4
Beds
2
Baths
2,562
Sq Ft
$122/Sq Ft
Est. Value
About This Home
This home is located at 47 Phillips St, Greenfield, MA 01301 and is currently estimated at $312,358, approximately $121 per square foot. 47 Phillips St is a home located in Franklin County with nearby schools including Four Rivers Charter Public School and Cornerstone Christian School.
Ownership History
Date
Name
Owned For
Owner Type
Purchase Details
Closed on
Oct 11, 2017
Sold by
Gougeon Corinne I and Gougeon Corrine I
Bought by
Laing Susan E
Current Estimated Value
Purchase Details
Closed on
Nov 14, 2011
Sold by
Pease Robert J
Bought by
Gougeon Corinne I
Create a Home Valuation Report for This Property
The Home Valuation Report is an in-depth analysis detailing your home's value as well as a comparison with similar homes in the area
Home Values in the Area
Average Home Value in this Area
Purchase History
| Date | Buyer | Sale Price | Title Company |
|---|---|---|---|
| Laing Susan E | $164,000 | -- | |
| Laing Susan E | $164,000 | -- | |
| Gougeon Corinne I | $151,750 | -- | |
| Gougeon Corinne I | $151,750 | -- |
Source: Public Records
Mortgage History
| Date | Status | Borrower | Loan Amount |
|---|---|---|---|
| Previous Owner | Gougeon Corinne I | $71,000 | |
| Previous Owner | Gougeon Corinne I | $10,000 |
Source: Public Records
Tax History
| Year | Tax Paid | Tax Assessment Tax Assessment Total Assessment is a certain percentage of the fair market value that is determined by local assessors to be the total taxable value of land and additions on the property. | Land | Improvement |
|---|---|---|---|---|
| 2025 | $4,757 | $243,200 | $48,700 | $194,500 |
| 2024 | $4,843 | $237,500 | $44,500 | $193,000 |
| 2023 | $4,182 | $212,800 | $44,500 | $168,300 |
| 2022 | $4,076 | $182,600 | $42,400 | $140,200 |
| 2021 | $3,971 | $171,000 | $45,500 | $125,500 |
| 2020 | $3,825 | $166,800 | $41,300 | $125,500 |
| 2019 | $3,611 | $161,500 | $36,000 | $125,500 |
| 2018 | $3,539 | $157,800 | $35,300 | $122,500 |
| 2017 | $3,403 | $156,600 | $35,300 | $121,300 |
| 2016 | $3,341 | $153,200 | $30,700 | $122,500 |
| 2015 | $3,264 | $145,000 | $31,100 | $113,900 |
| 2014 | $2,979 | $145,100 | $31,100 | $114,000 |
Source: Public Records
Map
Nearby Homes
- 36 West St
- 46 Colrain St
- 11 Colrain St
- 59-61 Conway St
- 173-175 Conway St
- 11 Conway St
- 89 Columbus Ave
- 83 Newton St
- 58A Laurel St
- 204 Countryside Unit 204
- 23 Robbins Rd
- 8 Water St
- 2 Water St
- 46 Kenwood St
- 44 Princeton Terrace Unit 44
- 73 Washington St
- 93 Maple St
- 414 Mohawk Trail
- 50 James St
- 0 Marshall St
Your Personal Tour Guide
Ask me questions while you tour the home.