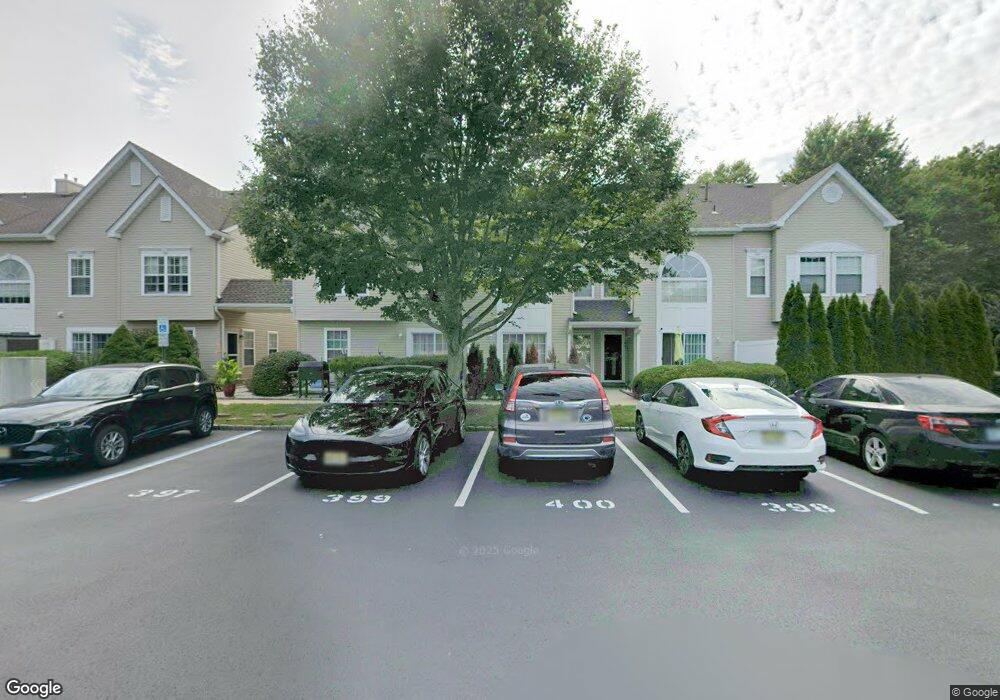
47 Phoenix Ct Tinton Falls, NJ 07712
Estimated Value: $465,000 - $498,000
2
Beds
2
Baths
1,463
Sq Ft
$325/Sq Ft
Est. Value
About This Home
This home is located at 47 Phoenix Ct, Tinton Falls, NJ 07712 and is currently estimated at $475,543, approximately $325 per square foot. 47 Phoenix Ct is a home located in Monmouth County with nearby schools including Mahala F. Atchinson Elementary School, Swimming River Elementary School, and Tinton Falls Middle School.
Ownership History
Date
Name
Owned For
Owner Type
Purchase Details
Closed on
Apr 16, 2001
Sold by
Ferrara Vincent
Bought by
Maruka Mary
Current Estimated Value
Purchase Details
Closed on
Oct 29, 1998
Sold by
Hovbilt Inc
Bought by
Ferrara Vincent and Ferrara Tina
Home Financials for this Owner
Home Financials are based on the most recent Mortgage that was taken out on this home.
Original Mortgage
$115,600
Interest Rate
6.84%
Create a Home Valuation Report for This Property
The Home Valuation Report is an in-depth analysis detailing your home's value as well as a comparison with similar homes in the area
Home Values in the Area
Average Home Value in this Area
Purchase History
| Date | Buyer | Sale Price | Title Company |
|---|---|---|---|
| Maruka Mary | $178,000 | -- | |
| Ferrara Vincent | $121,710 | -- |
Source: Public Records
Mortgage History
| Date | Status | Borrower | Loan Amount |
|---|---|---|---|
| Previous Owner | Ferrara Vincent | $115,600 |
Source: Public Records
Tax History Compared to Growth
Tax History
| Year | Tax Paid | Tax Assessment Tax Assessment Total Assessment is a certain percentage of the fair market value that is determined by local assessors to be the total taxable value of land and additions on the property. | Land | Improvement |
|---|---|---|---|---|
| 2025 | $6,270 | $439,100 | $252,000 | $187,100 |
| 2024 | $5,997 | $435,700 | $239,000 | $196,700 |
| 2023 | $5,997 | $393,000 | $200,000 | $193,000 |
| 2022 | $5,083 | $333,700 | $150,000 | $183,700 |
| 2021 | $4,682 | $276,900 | $125,000 | $151,900 |
| 2020 | $5,057 | $253,500 | $105,000 | $148,500 |
| 2019 | $4,932 | $247,600 | $100,000 | $147,600 |
| 2018 | $4,845 | $242,500 | $100,000 | $142,500 |
| 2017 | $4,813 | $234,900 | $95,000 | $139,900 |
| 2016 | $4,781 | $228,100 | $90,000 | $138,100 |
| 2015 | $4,465 | $227,800 | $90,000 | $137,800 |
| 2014 | $4,474 | $218,300 | $70,000 | $148,300 |
Source: Public Records
Map
Nearby Homes
- 45 Phoenix Ct
- 48 Phoenix Ct
- 49 Phoenix Ct
- 49 Phoenix Ct Unit 49
- 49 Phoenix Ct Unit 34
- 46 Phoenix Ct
- 43 Phoenix Ct
- 50 Phoenix Ct Unit 144
- 44 Phoenix Ct
- 41 Phoenix Ct
- 52 Phoenix Ct Unit 142
- 42 Phoenix Ct
- 53 Phoenix Ct
- 54 Phoenix Ct
- 55 Phoenix Ct
- 56 Phoenix Ct
- 40 Phoenix Ct
- 39 Phoenix Ct
- 38 Phoenix Ct
- 37 Phoenix Ct