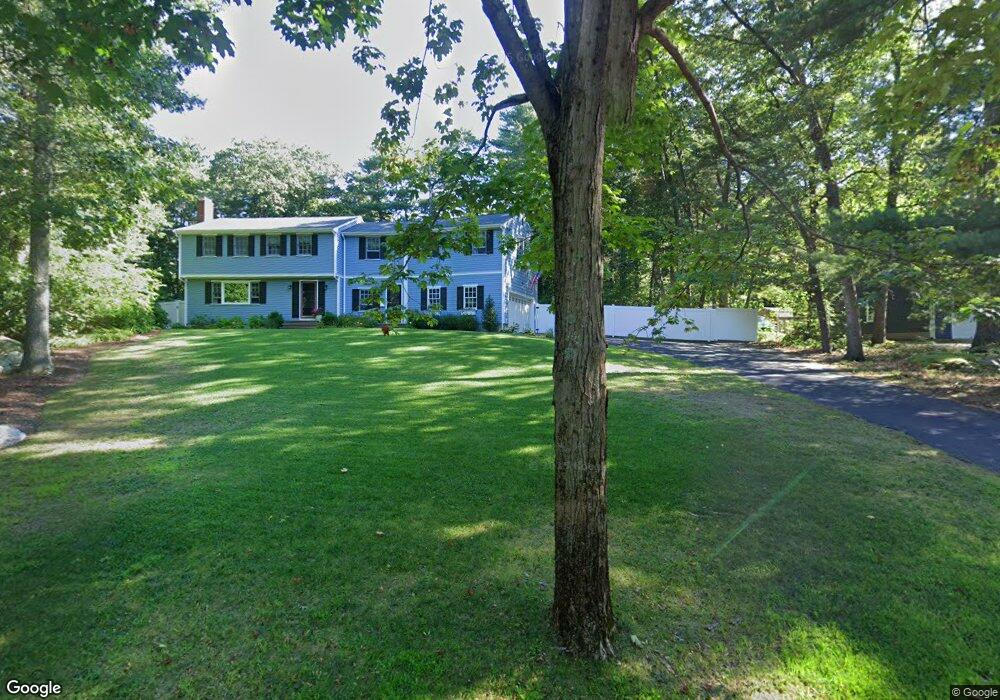
47 Pioneer Rd Hingham, MA 02043
South Hingham NeighborhoodEstimated Value: $1,343,000 - $1,538,000
4
Beds
3
Baths
3,269
Sq Ft
$447/Sq Ft
Est. Value
About This Home
This home is located at 47 Pioneer Rd, Hingham, MA 02043 and is currently estimated at $1,460,896, approximately $446 per square foot. 47 Pioneer Rd is a home located in Plymouth County with nearby schools including South Elementary School, Hingham Middle School, and Hingham High School.
Ownership History
Date
Name
Owned For
Owner Type
Purchase Details
Closed on
Sep 5, 2000
Sold by
Bogda Michael J and Mcbogda Susan Mc
Bought by
Costello Paul G and Costello Carol M
Current Estimated Value
Home Financials for this Owner
Home Financials are based on the most recent Mortgage that was taken out on this home.
Original Mortgage
$252,700
Interest Rate
8.16%
Mortgage Type
Purchase Money Mortgage
Purchase Details
Closed on
Sep 1, 2000
Sold by
Bogda Michael J and Mcbogda Susan Mc
Bought by
Costello Paul G and Costello Carolm
Home Financials for this Owner
Home Financials are based on the most recent Mortgage that was taken out on this home.
Original Mortgage
$252,700
Interest Rate
8.16%
Mortgage Type
Purchase Money Mortgage
Purchase Details
Closed on
Dec 1, 1997
Sold by
Beszterczey Akos and Beszterczey Lesley
Bought by
Bogda Michael J and Mcbogda Susan Mc
Create a Home Valuation Report for This Property
The Home Valuation Report is an in-depth analysis detailing your home's value as well as a comparison with similar homes in the area
Home Values in the Area
Average Home Value in this Area
Purchase History
| Date | Buyer | Sale Price | Title Company |
|---|---|---|---|
| Costello Paul G | $489,900 | -- | |
| Costello Paul G | $489,900 | -- | |
| Bogda Michael J | $355,000 | -- |
Source: Public Records
Mortgage History
| Date | Status | Borrower | Loan Amount |
|---|---|---|---|
| Open | Bogda Michael J | $417,000 | |
| Closed | Bogda Michael J | $252,700 |
Source: Public Records
Tax History
| Year | Tax Paid | Tax Assessment Tax Assessment Total Assessment is a certain percentage of the fair market value that is determined by local assessors to be the total taxable value of land and additions on the property. | Land | Improvement |
|---|---|---|---|---|
| 2025 | $11,406 | $1,067,000 | $551,800 | $515,200 |
| 2024 | $11,093 | $1,022,400 | $551,800 | $470,600 |
| 2023 | $9,803 | $980,300 | $551,800 | $428,500 |
| 2022 | $9,217 | $797,300 | $453,500 | $343,800 |
| 2021 | $9,059 | $767,700 | $453,500 | $314,200 |
| 2020 | $8,852 | $767,700 | $453,500 | $314,200 |
| 2019 | $8,832 | $747,800 | $453,500 | $294,300 |
| 2018 | $8,802 | $747,800 | $453,500 | $294,300 |
| 2017 | $8,530 | $696,300 | $450,100 | $246,200 |
| 2016 | $8,380 | $670,900 | $428,900 | $242,000 |
| 2015 | $8,151 | $650,500 | $408,500 | $242,000 |
Source: Public Records
Map
Nearby Homes
- 2 Black Rock Dr Unit 21
- 2 Black Rock Dr
- 249 High St
- 1 Kerri Ln
- 4 Kerri Ln
- 86 Black Rock Dr
- 32-70 Lazell St
- 1 Gardner Terrace
- 183 Gardner St
- 21 S Bradford Rd
- 70 Lazell St
- 18 Whiting Ln
- 4 Richard Rd
- 32 Lazell St
- 10 Colby Rd
- 6 Brewer Way
- 22 Linscott Rd
- 14 Old Stone Way Unit 11
- 168 Stayner Dr Unit 168
- 100 Whiting St