47 Power Ave Ludlow, MA 01056
Estimated Value: $263,000 - $348,000
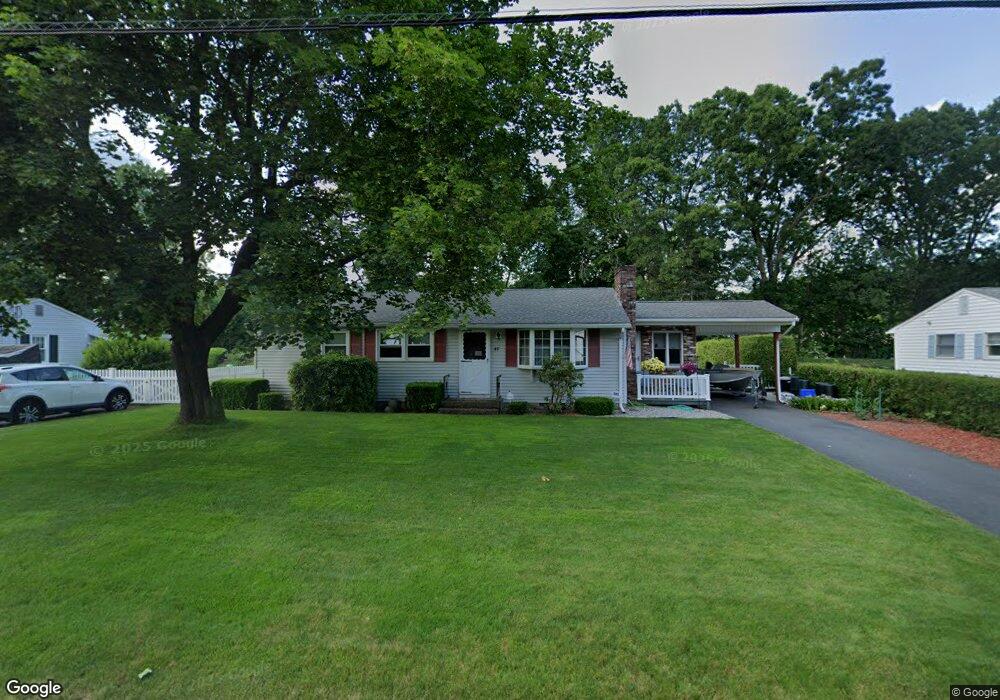
About This Home
This home is located at 47 Power Ave, Ludlow, MA 01056 and is currently estimated at $312,035, approximately $264 per square foot. 47 Power Ave is a home located in Hampden County with nearby schools including East Street Elementary School, Chapin Street Elementary School, and Paul R. Baird Middle School.
Ownership History
We collect this data history from publicly available records. To have your information removed, we recommend requesting removal directly through your county’s website.
Purchase Details
Purchase Details
Home Values in the Area
Average Home Value in this Area
Purchase History
We collect this data history from publicly available records. To have your information removed, we recommend requesting removal directly through your county’s website.
| Date | Buyer | Sale Price | Title Company |
|---|---|---|---|
| -- | -- | ||
| -- | -- | ||
| -- | -- |
Mortgage History
We collect this data history from publicly available records. To have your information removed, we recommend requesting removal directly through your county’s website.
| Date | Status | Borrower | Loan Amount |
|---|---|---|---|
| Previous Owner | $25,000 | ||
| Previous Owner | $55,000 | ||
| Previous Owner | $52,000 |
Tax History
We collect this data history from publicly available records. To have your information removed, we recommend requesting removal directly through your county’s website.
| Year | Tax Paid | Tax Assessment Tax Assessment Total Assessment is a certain percentage of the fair market value that is determined by local assessors to be the total taxable value of land and additions on the property. | Land | Improvement |
|---|---|---|---|---|
| 2025 | $4,429 | $255,300 | $85,100 | $170,200 |
| 2024 | $4,238 | $234,300 | $85,100 | $149,200 |
| 2023 | $4,064 | $208,300 | $78,000 | $130,300 |
| 2022 | $3,648 | $182,500 | $71,500 | $111,000 |
| 2021 | $3,710 | $176,000 | $71,500 | $104,500 |
| 2020 | $3,592 | $174,200 | $70,400 | $103,800 |
| 2019 | $3,377 | $170,400 | $69,700 | $100,700 |
| 2018 | $3,199 | $168,300 | $69,700 | $98,600 |
| 2017 | $3,007 | $162,300 | $61,500 | $100,800 |
| 2016 | $2,852 | $157,300 | $60,300 | $97,000 |
| 2015 | $2,702 | $156,300 | $59,600 | $96,700 |
Map
- 30 Circuit Ave
- 19 Voltage Ave
- 102 Miller St
- 229 Miller St Unit F-6
- 229 Miller St Unit C9
- 229 Miller St Unit D-6
- 108 Oak Knoll Cir
- 308 Miller St Unit 77
- 308 Miller St Unit 79
- 80 Elizabeth Dr
- 176 Genovevo Dr
- 37 Balsam Hill Rd
- 142 Marion Cir
- 32 Balsam Hill Rd
- 14 Balsam Hill Rd
- 4 Wilson St
- 44 Balsam Hill Rd
- 49 Balsam Hill Rd
- 28 Lake Dr
- 35 Lake Dr
Ask me questions while you tour the home.