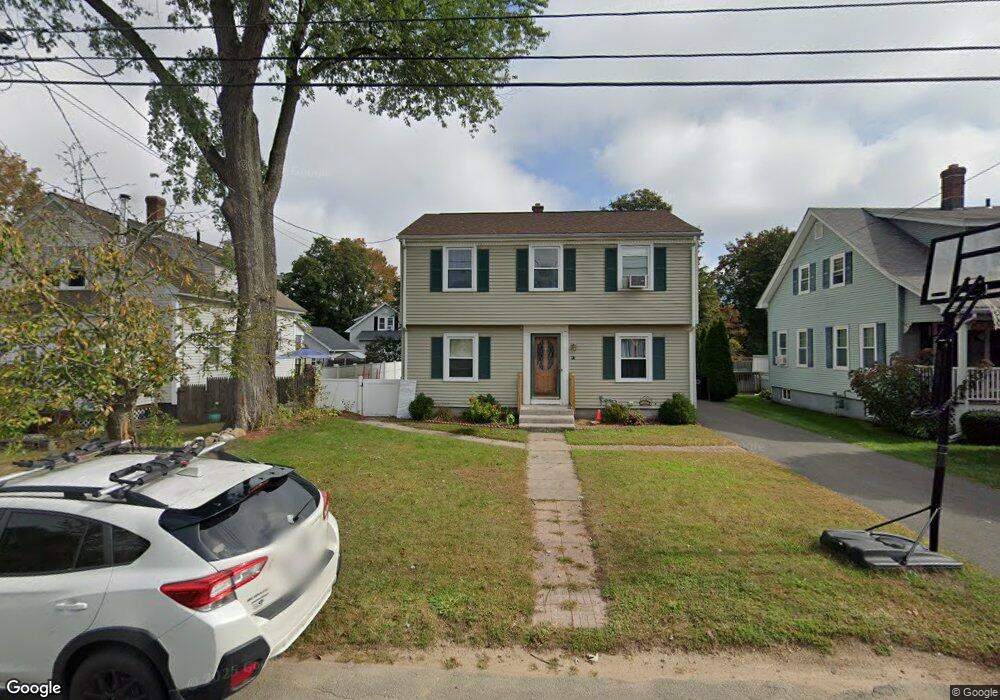
47 Queen St Westfield, MA 01085
Estimated Value: $301,448 - $364,000
5
Beds
2
Baths
1,612
Sq Ft
$212/Sq Ft
Est. Value
About This Home
This home is located at 47 Queen St, Westfield, MA 01085 and is currently estimated at $342,362, approximately $212 per square foot. 47 Queen St is a home located in Hampden County with nearby schools including Westfield High School and Saint Mary High School.
Ownership History
Date
Name
Owned For
Owner Type
Purchase Details
Closed on
Jul 13, 2016
Sold by
Mello Joseph A
Bought by
Mello Edyta J
Current Estimated Value
Purchase Details
Closed on
Jul 1, 2008
Sold by
Noblit Gina L and Sullivan Gina L
Bought by
Mello Edyta J and Mello Joseph A
Home Financials for this Owner
Home Financials are based on the most recent Mortgage that was taken out on this home.
Original Mortgage
$182,700
Interest Rate
6.07%
Mortgage Type
Purchase Money Mortgage
Purchase Details
Closed on
Aug 15, 2003
Sold by
Desormier Jason L and Desormier Tina M
Bought by
Sullivan Gina L
Home Financials for this Owner
Home Financials are based on the most recent Mortgage that was taken out on this home.
Original Mortgage
$124,000
Interest Rate
5.46%
Mortgage Type
Purchase Money Mortgage
Create a Home Valuation Report for This Property
The Home Valuation Report is an in-depth analysis detailing your home's value as well as a comparison with similar homes in the area
Home Values in the Area
Average Home Value in this Area
Purchase History
| Date | Buyer | Sale Price | Title Company |
|---|---|---|---|
| Mello Edyta J | -- | -- | |
| Mello Edyta J | $203,000 | -- | |
| Sullivan Gina L | $155,000 | -- |
Source: Public Records
Mortgage History
| Date | Status | Borrower | Loan Amount |
|---|---|---|---|
| Previous Owner | Mello Edyta J | $182,700 | |
| Previous Owner | Sullivan Gina L | $124,000 | |
| Previous Owner | Sullivan Gina L | $15,500 |
Source: Public Records
Tax History
| Year | Tax Paid | Tax Assessment Tax Assessment Total Assessment is a certain percentage of the fair market value that is determined by local assessors to be the total taxable value of land and additions on the property. | Land | Improvement |
|---|---|---|---|---|
| 2025 | $4,231 | $278,700 | $95,600 | $183,100 |
| 2024 | $4,234 | $265,100 | $86,900 | $178,200 |
| 2023 | $3,929 | $239,600 | $82,800 | $156,800 |
| 2022 | $3,929 | $212,500 | $73,900 | $138,600 |
| 2021 | $3,808 | $201,700 | $69,700 | $132,000 |
| 2020 | $3,692 | $191,800 | $69,700 | $122,100 |
| 2019 | $3,611 | $183,600 | $66,400 | $117,200 |
| 2018 | $3,554 | $183,600 | $66,400 | $117,200 |
| 2017 | $3,488 | $179,600 | $67,400 | $112,200 |
| 2016 | $3,491 | $179,600 | $67,400 | $112,200 |
| 2015 | $3,207 | $173,000 | $67,400 | $105,600 |
| 2014 | $2,397 | $173,000 | $67,400 | $105,600 |
Source: Public Records
Map
Nearby Homes
- 0 Lockhouse Rd Unit 73496193
- 9 Montgomery St
- Lot 5 Montgomery
- 19 Arch Rd
- 88 Woodmont St
- 182 Lockhouse Rd
- 19 Kellogg St
- 97 Mechanic St
- 205 Elm St
- 100 Meadow St
- 13 Hampden St
- 13 Green Ave
- 274 Prospect Street Extension
- 180 Russell Rd
- 20 Perkins St
- 64 Brookline Ave
- 26 Hayre St
- 324 Russell Rd Unit 109
- 12 Woodland Rd
- 336 Paper Mill Rd
Your Personal Tour Guide
Ask me questions while you tour the home.