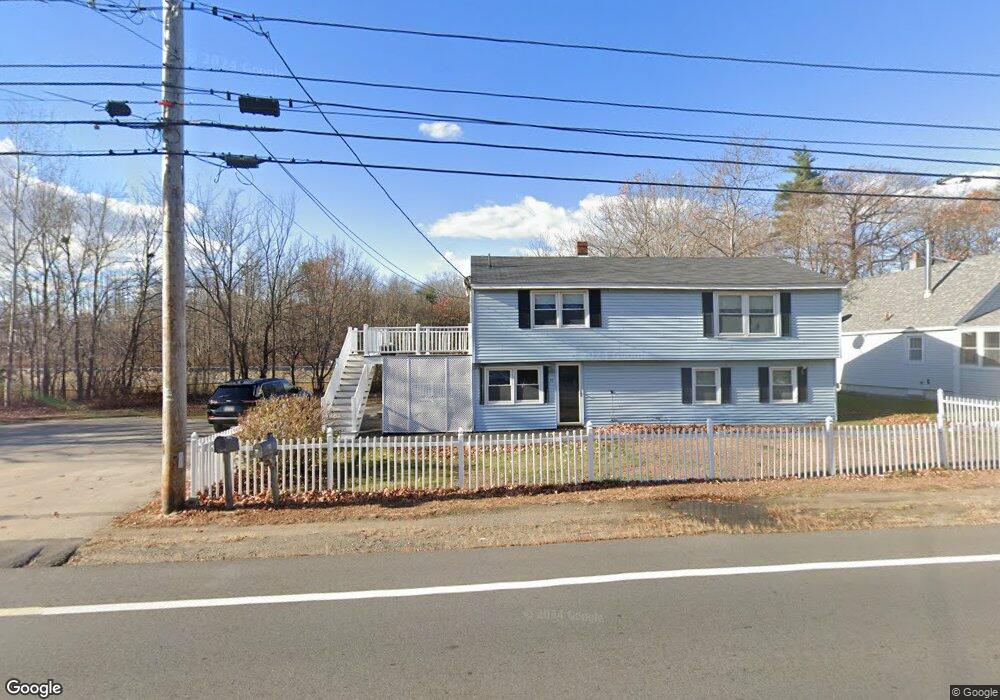
47 Rabbit Rd Salisbury, MA 01952
Estimated Value: $458,000 - $623,000
5
Beds
2
Baths
1,864
Sq Ft
$284/Sq Ft
Est. Value
About This Home
This home is located at 47 Rabbit Rd, Salisbury, MA 01952 and is currently estimated at $528,870, approximately $283 per square foot. 47 Rabbit Rd is a home located in Essex County with nearby schools including Triton Regional High School.
Ownership History
Date
Name
Owned For
Owner Type
Purchase Details
Closed on
Sep 13, 2024
Sold by
Simmons Richard C and Simmons Emma
Bought by
Simmons
Current Estimated Value
Purchase Details
Closed on
Mar 12, 2010
Sold by
Simmons Richard C and Lattime Gardner
Bought by
Simmons Emma and Simmons Richard C
Purchase Details
Closed on
Apr 1, 1992
Sold by
Sleeper Mary E and Foley Mary
Bought by
Perry Mitchell O and Perry Wanda G
Home Financials for this Owner
Home Financials are based on the most recent Mortgage that was taken out on this home.
Original Mortgage
$75,000
Interest Rate
8.73%
Mortgage Type
Purchase Money Mortgage
Create a Home Valuation Report for This Property
The Home Valuation Report is an in-depth analysis detailing your home's value as well as a comparison with similar homes in the area
Home Values in the Area
Average Home Value in this Area
Purchase History
| Date | Buyer | Sale Price | Title Company |
|---|---|---|---|
| Simmons | -- | None Available | |
| Simmons | -- | None Available | |
| Simmons Emma | -- | -- | |
| Simmons Emma | -- | -- | |
| Perry Mitchell O | $94,000 | -- |
Source: Public Records
Mortgage History
| Date | Status | Borrower | Loan Amount |
|---|---|---|---|
| Previous Owner | Perry Mitchell O | $75,000 | |
| Previous Owner | Perry Mitchell O | $17,000 |
Source: Public Records
Tax History
| Year | Tax Paid | Tax Assessment Tax Assessment Total Assessment is a certain percentage of the fair market value that is determined by local assessors to be the total taxable value of land and additions on the property. | Land | Improvement |
|---|---|---|---|---|
| 2025 | $3,956 | $392,500 | $137,900 | $254,600 |
| 2024 | $4,182 | $400,200 | $137,900 | $262,300 |
| 2023 | $2,886 | $326,000 | $137,900 | $188,100 |
| 2022 | $2,690 | $309,700 | $121,600 | $188,100 |
| 2021 | $2,652 | $298,700 | $121,600 | $177,100 |
| 2020 | $3,328 | $290,400 | $121,600 | $168,800 |
| 2019 | $2,344 | $273,700 | $117,500 | $156,200 |
| 2018 | $2,159 | $262,700 | $106,600 | $156,100 |
| 2017 | $2,006 | $235,300 | $97,100 | $138,200 |
| 2016 | $2,697 | $231,100 | $93,100 | $138,000 |
| 2015 | $2,585 | $220,000 | $84,900 | $135,100 |
Source: Public Records
Map
Nearby Homes
- 53 Rabbit Rd
- 57 Baker Rd
- 82 Monroe St
- 191 Elm St
- 3 Birchwood Point Unit 202
- 7 Birchwood Pointe Unit 101
- 25 Bayberry Ln
- 7 Toll Rd
- 21 Congress St
- 154 Lafayette Rd
- 382 Main St
- 21 River St
- 2 True Rd
- 97 Elm St
- 188 Lafayette Rd
- 42 Kendell Ln
- 510 Merrimac St Unit 512
- 25 Cedar St Unit 4
- 4 Clark St
- 492 Merrimac St
Your Personal Tour Guide
Ask me questions while you tour the home.