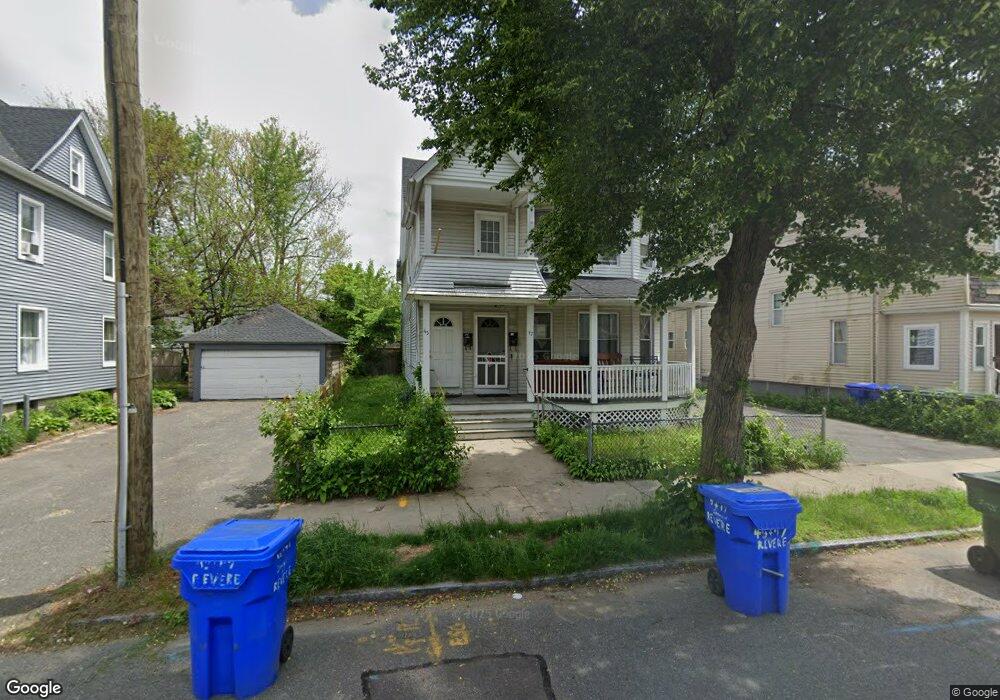
47 Revere St Springfield, MA 01108
Forest Park NeighborhoodEstimated Value: $321,000 - $407,327
6
Beds
3
Baths
2,877
Sq Ft
$127/Sq Ft
Est. Value
About This Home
This home is located at 47 Revere St, Springfield, MA 01108 and is currently estimated at $365,832, approximately $127 per square foot. 47 Revere St is a home located in Hampden County with nearby schools including Kensington International School, M Marcus Kiley Middle, and High School Of Commerce.
Ownership History
Date
Name
Owned For
Owner Type
Purchase Details
Closed on
Jan 5, 2022
Sold by
Nguyen Thu H
Bought by
Zapata Eddy
Current Estimated Value
Home Financials for this Owner
Home Financials are based on the most recent Mortgage that was taken out on this home.
Original Mortgage
$225,834
Outstanding Balance
$207,309
Interest Rate
3.12%
Mortgage Type
FHA
Estimated Equity
$158,523
Purchase Details
Closed on
Aug 30, 2004
Sold by
Ronghi Ugo
Bought by
Ronghi Thu H
Purchase Details
Closed on
Jul 1, 1985
Bought by
Ronghi Thu H
Create a Home Valuation Report for This Property
The Home Valuation Report is an in-depth analysis detailing your home's value as well as a comparison with similar homes in the area
Home Values in the Area
Average Home Value in this Area
Purchase History
| Date | Buyer | Sale Price | Title Company |
|---|---|---|---|
| Zapata Eddy | $230,000 | None Available | |
| Ronghi Thu H | -- | -- | |
| Ronghi Thu H | -- | -- | |
| Ronghi Thu H | $63,000 | -- |
Source: Public Records
Mortgage History
| Date | Status | Borrower | Loan Amount |
|---|---|---|---|
| Open | Zapata Eddy | $225,834 | |
| Previous Owner | Ronghi Thu H | $25,000 | |
| Previous Owner | Ronghi Thu H | $40,000 |
Source: Public Records
Tax History Compared to Growth
Tax History
| Year | Tax Paid | Tax Assessment Tax Assessment Total Assessment is a certain percentage of the fair market value that is determined by local assessors to be the total taxable value of land and additions on the property. | Land | Improvement |
|---|---|---|---|---|
| 2025 | $5,051 | $322,100 | $31,200 | $290,900 |
| 2024 | $4,198 | $261,400 | $31,200 | $230,200 |
| 2023 | $4,198 | $246,200 | $28,400 | $217,800 |
| 2022 | $4,120 | $218,900 | $26,500 | $192,400 |
| 2021 | $3,493 | $184,800 | $24,100 | $160,700 |
| 2020 | $3,400 | $174,100 | $24,100 | $150,000 |
| 2019 | $3,206 | $162,900 | $24,100 | $138,800 |
| 2018 | $2,884 | $153,000 | $24,100 | $128,900 |
| 2017 | $2,884 | $146,700 | $22,600 | $124,100 |
| 2016 | $2,513 | $127,800 | $22,600 | $105,200 |
| 2015 | -- | $125,300 | $22,600 | $102,700 |
Source: Public Records
Map
Nearby Homes