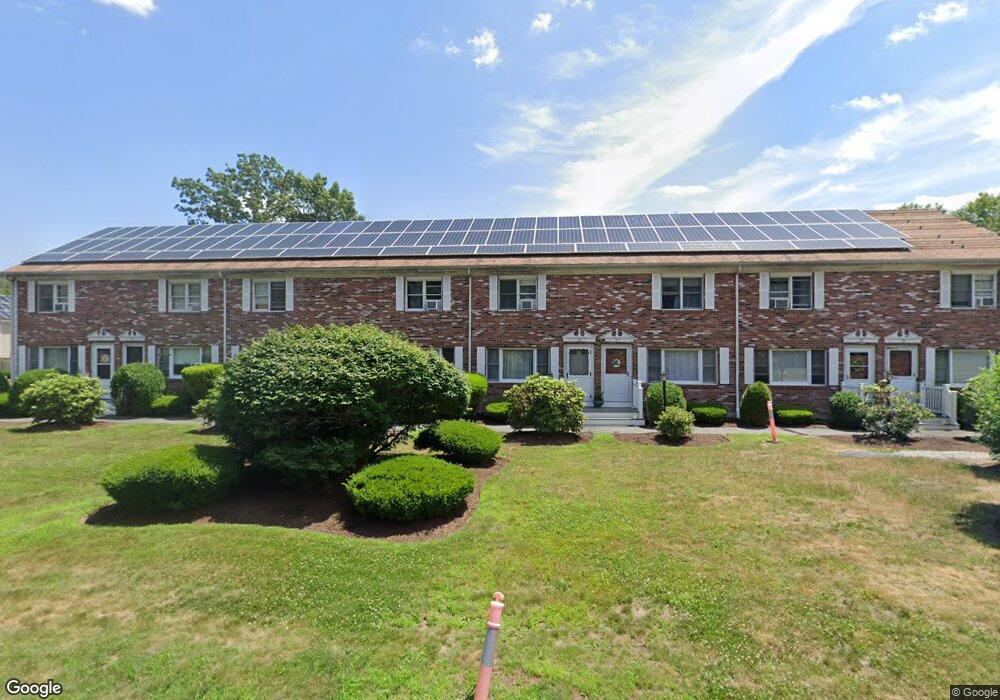
47 Robins St East Bridgewater, MA 02333
Estimated Value: $364,000 - $400,000
2
Beds
2
Baths
1,152
Sq Ft
$331/Sq Ft
Est. Value
About This Home
This home is located at 47 Robins St, East Bridgewater, MA 02333 and is currently estimated at $381,011, approximately $330 per square foot. 47 Robins St is a home located in Plymouth County with nearby schools including Gordon W Mitchell Middle School and East Bridgewater Jr./Sr. High School.
Ownership History
Date
Name
Owned For
Owner Type
Purchase Details
Closed on
Mar 2, 2007
Sold by
Bedrosian Gregory M
Bought by
Bedrosian Grergory M and Bedrosian Cheryl
Current Estimated Value
Home Financials for this Owner
Home Financials are based on the most recent Mortgage that was taken out on this home.
Original Mortgage
$168,000
Outstanding Balance
$102,079
Interest Rate
6.24%
Estimated Equity
$278,932
Purchase Details
Closed on
Apr 30, 2003
Sold by
Paul Luana R
Bought by
Bedrosian Gregory M
Purchase Details
Closed on
Jul 28, 2000
Sold by
Huddy Gail M
Bought by
Paul Luana R
Purchase Details
Closed on
Nov 25, 1998
Sold by
Lothrop James D
Bought by
Huddy Gail M
Purchase Details
Closed on
Mar 29, 1996
Sold by
Gerrior Paul F and Gerrior Cynthia Y
Bought by
Lothrop James D
Purchase Details
Closed on
Mar 28, 1995
Sold by
Topham Brian and Topham Kendra L
Bought by
Gerrior Cynthia Y and Gerrior Paul F
Purchase Details
Closed on
Apr 30, 1993
Sold by
Home Sb
Bought by
Topham Brian and King Kenda L
Purchase Details
Closed on
Aug 13, 1992
Sold by
Vincent Raymond F
Bought by
Home Sb America
Purchase Details
Closed on
Nov 24, 1987
Sold by
Walling Walter L
Bought by
Vincent Raymond F
Create a Home Valuation Report for This Property
The Home Valuation Report is an in-depth analysis detailing your home's value as well as a comparison with similar homes in the area
Home Values in the Area
Average Home Value in this Area
Purchase History
| Date | Buyer | Sale Price | Title Company |
|---|---|---|---|
| Bedrosian Grergory M | -- | -- | |
| Bedrosian Gregory M | $185,900 | -- | |
| Paul Luana R | $126,000 | -- | |
| Huddy Gail M | $93,500 | -- | |
| Lothrop James D | $87,000 | -- | |
| Gerrior Cynthia Y | $84,900 | -- | |
| Topham Brian | $75,000 | -- | |
| Home Sb America | $127,353 | -- | |
| Vincent Raymond F | $118,500 | -- |
Source: Public Records
Mortgage History
| Date | Status | Borrower | Loan Amount |
|---|---|---|---|
| Open | Vincent Raymond F | $168,000 | |
| Previous Owner | Vincent Raymond F | $35,000 |
Source: Public Records
Tax History Compared to Growth
Tax History
| Year | Tax Paid | Tax Assessment Tax Assessment Total Assessment is a certain percentage of the fair market value that is determined by local assessors to be the total taxable value of land and additions on the property. | Land | Improvement |
|---|---|---|---|---|
| 2025 | $4,120 | $301,400 | $0 | $301,400 |
| 2024 | $3,954 | $285,700 | $0 | $285,700 |
| 2023 | $3,712 | $256,900 | $0 | $256,900 |
| 2022 | $3,501 | $224,400 | $0 | $224,400 |
| 2021 | $3,420 | $200,600 | $0 | $200,600 |
| 2020 | $3,385 | $195,800 | $0 | $195,800 |
| 2019 | $3,180 | $181,100 | $0 | $181,100 |
| 2018 | $2,969 | $165,300 | $0 | $165,300 |
| 2017 | $2,714 | $148,300 | $0 | $148,300 |
| 2016 | $2,617 | $144,100 | $0 | $144,100 |
| 2015 | $2,684 | $151,100 | $0 | $151,100 |
| 2014 | $2,602 | $149,800 | $0 | $149,800 |
Source: Public Records
Map
Nearby Homes
- 1 Robins St Unit 1
- 96 Trailwood Dr
- 24 High Pond Dr
- 67 Country Dr
- 23 Stone Meadow Dr
- 1993 Washington St
- 114 Plain St
- 148 Lot 1a Elm St
- 1 Lamppost Dr
- 10 Eliab Latham Way
- 74 Magnolia Way
- Lot 1 Mill St
- 780 Old Plymouth St
- 4 Sycamore Ln
- 0 Three Rivers Dr
- 477 Cherry St
- 2 Lydon Ln Unit A1
- 199 Cherry St
- 865 Plymouth St Unit 865
- 26 Old Summit St