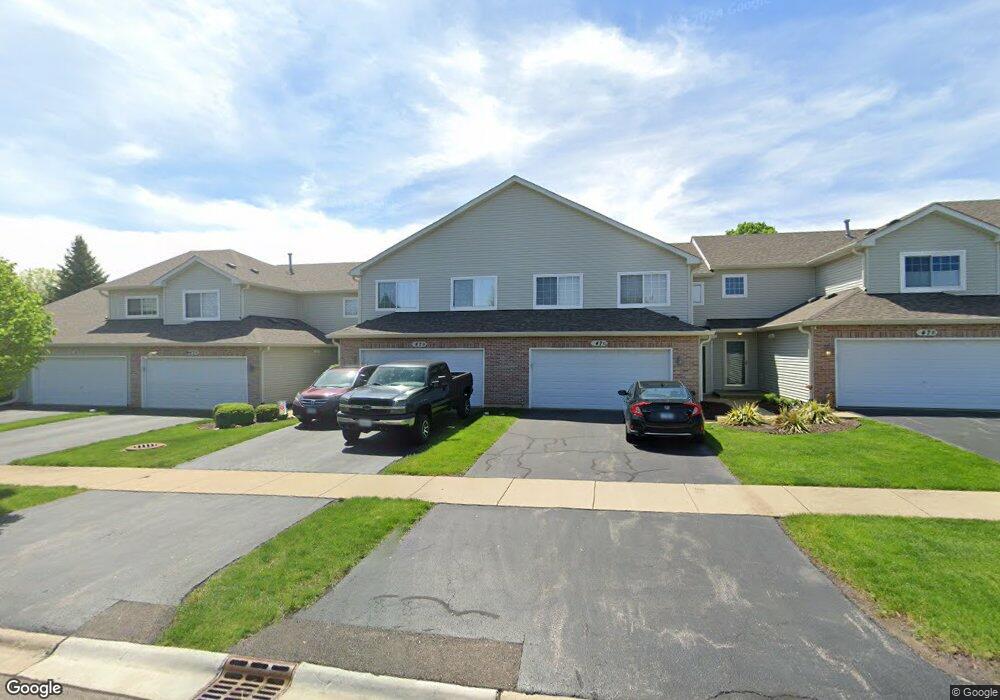
47 Rolling Oaks Rd Unit C Sugar Grove, IL 60554
Estimated Value: $212,000 - $280,000
--
Bed
--
Bath
1,466
Sq Ft
$167/Sq Ft
Est. Value
About This Home
This home is located at 47 Rolling Oaks Rd Unit C, Sugar Grove, IL 60554 and is currently estimated at $244,644, approximately $166 per square foot. 47 Rolling Oaks Rd Unit C is a home located in Kane County with nearby schools including Kaneland Mcdole Elementary School, Harter Middle School, and Kaneland Senior High School.
Ownership History
Date
Name
Owned For
Owner Type
Purchase Details
Closed on
May 5, 2025
Sold by
Mitchell Gina
Bought by
Fanucci Jonathan
Current Estimated Value
Purchase Details
Closed on
Jan 9, 2023
Sold by
2725 Trust
Bought by
Mitchell Gina
Purchase Details
Closed on
Jan 21, 2012
Sold by
Marquette Bank
Bought by
Gesiakowska Joann and The 2725 Trust
Purchase Details
Closed on
Apr 23, 2004
Sold by
Gesiakowska Joann
Bought by
Marquette Bank and Trust #17076
Purchase Details
Closed on
Dec 17, 2003
Sold by
Tanglewood Development Corp
Bought by
Gesiakowska Jo Ann
Home Financials for this Owner
Home Financials are based on the most recent Mortgage that was taken out on this home.
Original Mortgage
$105,000
Interest Rate
6.04%
Mortgage Type
Purchase Money Mortgage
Create a Home Valuation Report for This Property
The Home Valuation Report is an in-depth analysis detailing your home's value as well as a comparison with similar homes in the area
Home Values in the Area
Average Home Value in this Area
Purchase History
| Date | Buyer | Sale Price | Title Company |
|---|---|---|---|
| Fanucci Jonathan | $210,000 | Freedom Title | |
| Mitchell Gina | -- | -- | |
| Gesiakowska Joann | -- | None Available | |
| Marquette Bank | -- | -- | |
| Gesiakowska Jo Ann | $160,500 | First American Title |
Source: Public Records
Mortgage History
| Date | Status | Borrower | Loan Amount |
|---|---|---|---|
| Previous Owner | Gesiakowska Jo Ann | $105,000 |
Source: Public Records
Tax History Compared to Growth
Tax History
| Year | Tax Paid | Tax Assessment Tax Assessment Total Assessment is a certain percentage of the fair market value that is determined by local assessors to be the total taxable value of land and additions on the property. | Land | Improvement |
|---|---|---|---|---|
| 2024 | $6,234 | $71,904 | $7,906 | $63,998 |
| 2023 | $6,073 | $64,848 | $7,130 | $57,718 |
| 2022 | $5,774 | $59,867 | $6,582 | $53,285 |
| 2021 | $5,585 | $56,973 | $6,264 | $50,709 |
| 2020 | $5,515 | $55,757 | $6,130 | $49,627 |
| 2019 | $5,442 | $53,934 | $5,930 | $48,004 |
| 2018 | $5,478 | $52,979 | $6,936 | $46,043 |
| 2017 | $5,330 | $50,596 | $6,624 | $43,972 |
| 2016 | $5,222 | $48,366 | $6,332 | $42,034 |
| 2015 | -- | $45,000 | $5,891 | $39,109 |
| 2014 | -- | $43,029 | $5,633 | $37,396 |
| 2013 | -- | $43,481 | $5,692 | $37,789 |
Source: Public Records
Map
Nearby Homes
- 389 Mallard Ln
- 369 Mallard Ln
- 92 Maple St
- 110 S Sugar Grove Pkwy
- 73 Neil Rd
- 240 Snow St
- 123 Terry Dr
- 191 Meadows Dr
- 1130 Cone Flower Cir
- 170 Coneflower St
- 160 Isbell Dr
- 230 St James Pkwy Unit A
- 174 Brompton Ln Unit A
- 1195 Settlers Blvd Unit B
- 1266 Airs Ave
- 206 Brompton Ln Unit A
- 261 Hampton Rd Unit 1
- 1290 Airs Ave
- 1310 Airs Ave
- 1715 Ivy Ln
- 47 Rolling Oaks Rd Unit F
- 47 Rolling Oaks Rd Unit A
- 47 Rolling Oaks Rd Unit B
- 47 Rolling Oaks Rd Unit E
- 47 Rolling Oaks Rd Unit D
- 47 Rolling Oaks Rd Unit 47B
- 533 Mallard Ln Unit A
- 533 Mallard Ln Unit D
- 533 Mallard Ln Unit E
- 533 Mallard Ln Unit C
- 533 Mallard Ln Unit B
- 533 Mallard Ln Unit F
- 533 Mallard Ln Unit 533B
- 541 Mallard Ln
- 541 Mallard Ln
- 541 Mallard Ln Unit A
- 541 Mallard Ln Unit C
- 541 Mallard Ln Unit B
- 541 Mallard Ln Unit F
- 541 Mallard Ln Unit D