Estimated Value: $278,458 - $434,000
3
Beds
1
Bath
1,144
Sq Ft
$313/Sq Ft
Est. Value
About This Home
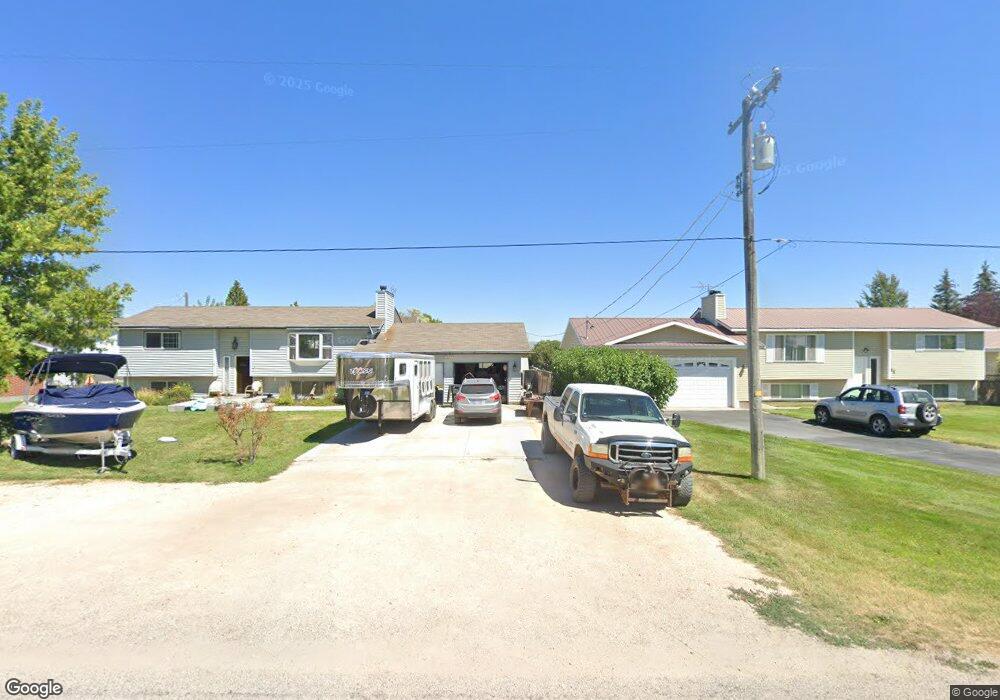
This home is located at 47 S 2nd E, Paris, ID 83261 and is currently estimated at $357,865, approximately $312 per square foot. 47 S 2nd E is a home located in Bear Lake County with nearby schools including Paris Elementary School and Bear Lake High School.
Ownership History
Date
Name
Owned For
Owner Type
Purchase Details
Closed on
Mar 2, 2017
Sold by
Williams Cristi
Bought by
Hamp Curtis and Hamp Janet
Current Estimated Value
Home Financials for this Owner
Home Financials are based on the most recent Mortgage that was taken out on this home.
Original Mortgage
$45,000
Outstanding Balance
$7,975
Interest Rate
4.09%
Mortgage Type
New Conventional
Estimated Equity
$349,890
Purchase Details
Closed on
May 15, 2015
Sold by
Williams Cristie J
Bought by
Williams Cristie J
Purchase Details
Closed on
Aug 31, 2010
Sold by
Humpherys Dale and Humpherys Kalleen
Bought by
Humpherys Shawn D
Purchase Details
Closed on
Nov 25, 2009
Sold by
Tatum Carla and Thomas Carla
Bought by
Langley Norma
Create a Home Valuation Report for This Property
The Home Valuation Report is an in-depth analysis detailing your home's value as well as a comparison with similar homes in the area
Purchase History
| Date | Buyer | Sale Price | Title Company |
|---|---|---|---|
| Hamp Curtis | -- | Northern Title Co | |
| Williams Cristie J | -- | None Available | |
| Humpherys Shawn D | -- | -- | |
| Langley Norma | -- | -- |
Source: Public Records
Mortgage History
| Date | Status | Borrower | Loan Amount |
|---|---|---|---|
| Open | Hamp Curtis | $45,000 |
Source: Public Records
Tax History
| Year | Tax Paid | Tax Assessment Tax Assessment Total Assessment is a certain percentage of the fair market value that is determined by local assessors to be the total taxable value of land and additions on the property. | Land | Improvement |
|---|---|---|---|---|
| 2025 | $710 | $197,630 | $60 | $197,570 |
| 2024 | $659 | $198,128 | $558 | $197,570 |
| 2023 | $625 | $232,653 | $57,678 | $174,975 |
| 2022 | $1,279 | $235,878 | $57,678 | $178,200 |
| 2021 | $1,226 | $161,142 | $40,392 | $120,750 |
| 2020 | $1,225 | $127,547 | $21,827 | $105,720 |
| 2019 | $1,204 | $126,547 | $21,827 | $104,720 |
| 2018 | $1,166 | $123,317 | $21,827 | $101,490 |
| 2017 | $1,173 | $122,857 | $21,827 | $101,030 |
| 2016 | $683 | $111,227 | $21,827 | $89,400 |
| 2015 | $1,075 | $196,247 | $113,187 | $83,060 |
| 2014 | $654 | $102,327 | $21,827 | $80,500 |
| 2010 | -- | $87,600 | $21,500 | $66,100 |
Source: Public Records
Map
Nearby Homes
- 229 S Main St Unit 4
- 102 S Main St
- 59 W 1st S
- 52 S Main St
- 0 U S Highway 89
- 32 N 2nd East St
- 149 N Main St
- 105 E 2nd North St
- 295 E 2nd St N
- 500 W 200 N
- 190 W 3rd N
- TBD U S Highway 89
- 357 W 3rd St N
- 270 N 50 E
- 22 Old Ranch Rd
- 8 200 N Unit 8
- 202 N 200 E
- 0 See Directions Unit 2127598
- 20352 Highway 89
- 108 South Rd
Your Personal Tour Guide
Ask me questions while you tour the home.