Estimated Value: $402,639 - $543,000
--
Bed
--
Bath
1,491
Sq Ft
$322/Sq Ft
Est. Value
About This Home
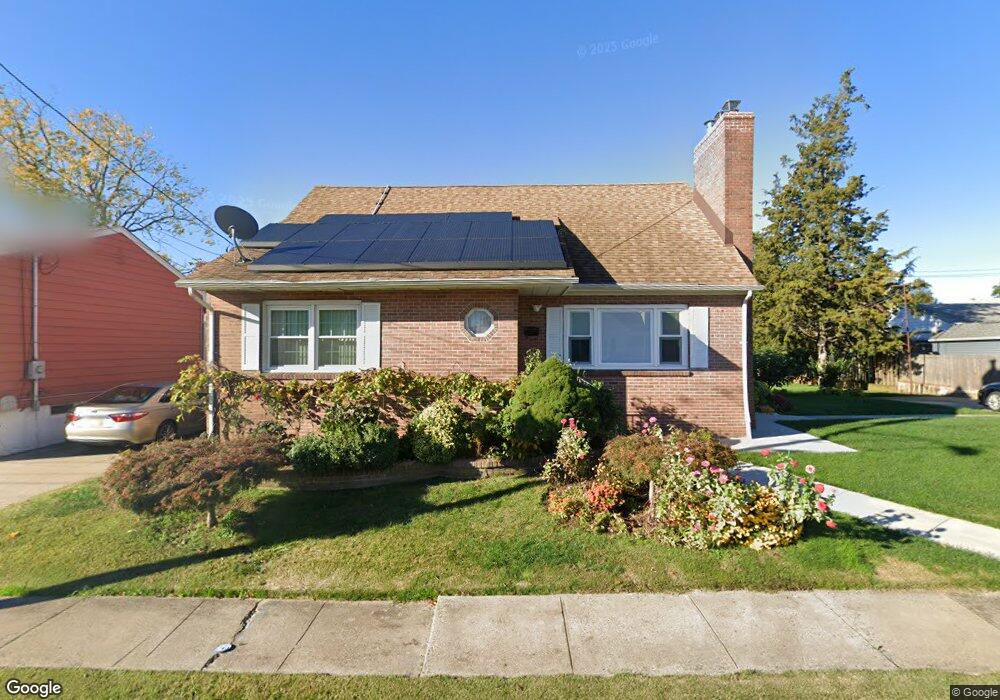
This home is located at 47 S Elm St, Fords, NJ 08863 and is currently estimated at $480,660, approximately $322 per square foot. 47 S Elm St is a home located in Middlesex County with nearby schools including Ford Avenue Elementary School, Fords Middle School, and Woodbridge High School.
Ownership History
Date
Name
Owned For
Owner Type
Purchase Details
Closed on
Jan 24, 2025
Sold by
Michaels Eva
Bought by
Eva A Michaels Revocable Trust and Michaels
Current Estimated Value
Purchase Details
Closed on
Mar 3, 1997
Sold by
Miller Christian
Bought by
Michaels Angelo
Home Financials for this Owner
Home Financials are based on the most recent Mortgage that was taken out on this home.
Original Mortgage
$144,000
Interest Rate
7.68%
Create a Home Valuation Report for This Property
The Home Valuation Report is an in-depth analysis detailing your home's value as well as a comparison with similar homes in the area
Home Values in the Area
Average Home Value in this Area
Purchase History
| Date | Buyer | Sale Price | Title Company |
|---|---|---|---|
| Eva A Michaels Revocable Trust | -- | None Listed On Document | |
| Eva A Michaels Revocable Trust | -- | None Listed On Document | |
| Michaels Angelo | $160,000 | -- |
Source: Public Records
Mortgage History
| Date | Status | Borrower | Loan Amount |
|---|---|---|---|
| Previous Owner | Michaels Angelo | $144,000 |
Source: Public Records
Tax History Compared to Growth
Tax History
| Year | Tax Paid | Tax Assessment Tax Assessment Total Assessment is a certain percentage of the fair market value that is determined by local assessors to be the total taxable value of land and additions on the property. | Land | Improvement |
|---|---|---|---|---|
| 2025 | $11,377 | $90,100 | $20,500 | $69,600 |
| 2024 | $11,045 | $90,100 | $20,500 | $69,600 |
| 2023 | $11,045 | $90,100 | $20,500 | $69,600 |
| 2022 | $10,378 | $87,000 | $20,500 | $66,500 |
| 2021 | $9,652 | $87,000 | $20,500 | $66,500 |
| 2020 | $9,937 | $87,000 | $20,500 | $66,500 |
| 2019 | $9,603 | $86,300 | $20,500 | $65,800 |
| 2018 | $9,414 | $86,300 | $20,500 | $65,800 |
| 2017 | $9,248 | $86,300 | $20,500 | $65,800 |
| 2016 | $9,172 | $86,300 | $20,500 | $65,800 |
| 2015 | $8,993 | $86,300 | $20,500 | $65,800 |
| 2014 | $8,797 | $86,300 | $20,500 | $65,800 |
Source: Public Records
Map
Nearby Homes
- 636 King Georges Rd
- 10 Mary Ave
- 141 Dunbar Ave
- 179 Liberty St
- 163 Winchester Rd
- 46 3rd St
- 805 King George Rd
- 805 King Georges Rd
- 891 Main St
- 37 Summit Ave
- 450 Crows Mill Rd
- 56 Ford Ave
- 99 Crestview Rd
- 111 Longview Cir
- 1 Olive St
- 26 Wildwood Ave
- 91 Corey St
- 25 Wildwood Ave
- 40 Ling St
- 38 Evergreen Ave