Estimated Value: $383,665 - $398,000
3
Beds
2
Baths
1,586
Sq Ft
$247/Sq Ft
Est. Value
About This Home
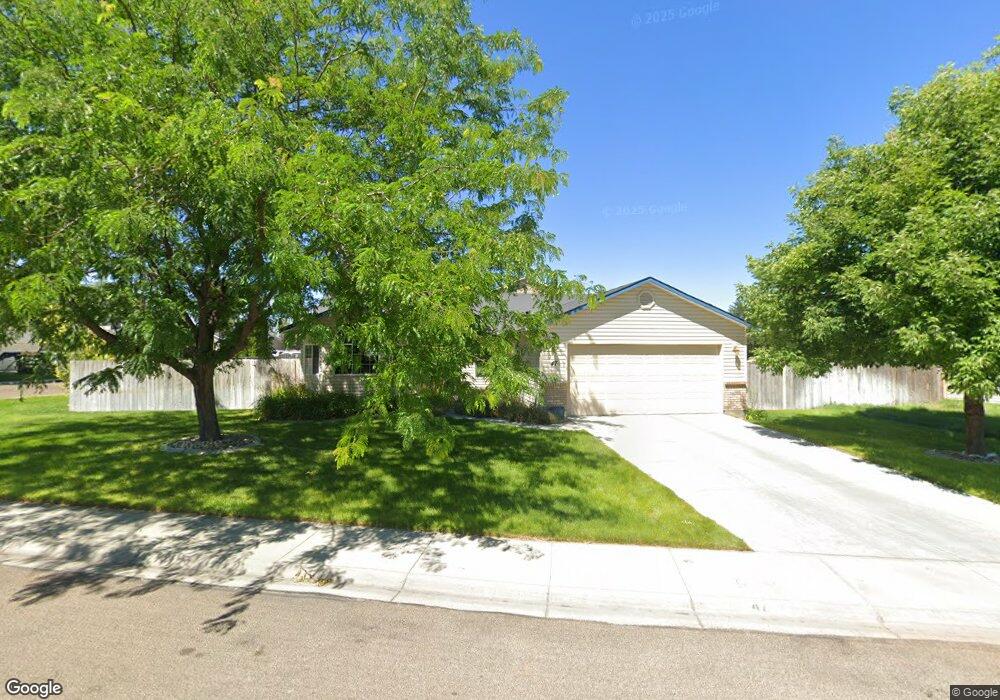
This home is located at 47 S Newberry Way, Nampa, ID 83651 and is currently estimated at $391,416, approximately $246 per square foot. 47 S Newberry Way is a home located in Canyon County with nearby schools including Roosevelt Elementary School, Lone Star Middle School, and Nampa Senior High School.
Ownership History
Date
Name
Owned For
Owner Type
Purchase Details
Closed on
Jun 22, 2017
Sold by
Smutny Katrina K
Bought by
Smutny Katrina K
Current Estimated Value
Home Financials for this Owner
Home Financials are based on the most recent Mortgage that was taken out on this home.
Original Mortgage
$95,500
Outstanding Balance
$79,436
Interest Rate
4.02%
Mortgage Type
New Conventional
Estimated Equity
$311,980
Purchase Details
Closed on
Nov 26, 2014
Sold by
Smutny Katrina K
Bought by
Smutny Katrina K and The Katrina Trust
Purchase Details
Closed on
Mar 18, 2005
Sold by
Corey Barton Homes Inc
Bought by
Smutny Katrina K
Home Financials for this Owner
Home Financials are based on the most recent Mortgage that was taken out on this home.
Original Mortgage
$106,032
Interest Rate
5.61%
Mortgage Type
New Conventional
Purchase Details
Closed on
Jul 27, 2004
Sold by
Dyver Development Llc
Bought by
Corey Barton Homes Inc
Create a Home Valuation Report for This Property
The Home Valuation Report is an in-depth analysis detailing your home's value as well as a comparison with similar homes in the area
Home Values in the Area
Average Home Value in this Area
Purchase History
| Date | Buyer | Sale Price | Title Company |
|---|---|---|---|
| Smutny Katrina K | -- | Fidelity Natl Title Boise | |
| Smutny Katrina K | -- | None Available | |
| Smutny Katrina K | -- | Pioneer Title Company Of Can | |
| Corey Barton Homes Inc | -- | Pioneer Title Company |
Source: Public Records
Mortgage History
| Date | Status | Borrower | Loan Amount |
|---|---|---|---|
| Open | Smutny Katrina K | $95,500 | |
| Closed | Smutny Katrina K | $106,032 | |
| Closed | Smutny Katrina K | $19,881 |
Source: Public Records
Tax History Compared to Growth
Tax History
| Year | Tax Paid | Tax Assessment Tax Assessment Total Assessment is a certain percentage of the fair market value that is determined by local assessors to be the total taxable value of land and additions on the property. | Land | Improvement |
|---|---|---|---|---|
| 2025 | $1,528 | $381,000 | $92,500 | $288,500 |
| 2024 | $1,528 | $371,800 | $92,500 | $279,300 |
| 2023 | $1,438 | $367,100 | $92,500 | $274,600 |
| 2022 | $2,108 | $410,600 | $123,400 | $287,200 |
| 2021 | $1,959 | $291,300 | $58,000 | $233,300 |
| 2020 | $1,658 | $228,000 | $51,500 | $176,500 |
| 2019 | $1,805 | $212,500 | $51,500 | $161,000 |
| 2018 | $1,663 | $0 | $0 | $0 |
| 2017 | $1,542 | $0 | $0 | $0 |
| 2016 | $1,461 | $0 | $0 | $0 |
| 2015 | $1,320 | $0 | $0 | $0 |
| 2014 | $1,196 | $122,700 | $21,000 | $101,700 |
Source: Public Records
Map
Nearby Homes
- 1906 W Meffan Ave
- 1913 W Meffan Ave
- 1916 W Havenwood Ave
- 1620 W Young Ave
- 2018 W Young St
- 30 S Lemhi Dr
- 48 S Lancaster Place
- 36 S Lancaster Dr
- 37 S Lancaster Place
- 1460 W Lark Ct
- 48 S Lancaster Dr
- 37 S Lancaster Dr
- 1314 W Hawk Ct
- 2100 W Swallowtail Place
- 1304 W Hawk Place
- 2157 W Swallowtail Place
- 1406 W Crystal Falls Ave
- 1113 W Blaine Ave
- 23 N Zion Park Dr
- 1107 W Blaine Ave
- 43 S Newberry Way
- 1834 W Blaine Ave
- 1787 W
- 1866 W Blaine Ave
- 46 S Newberry Way
- 48 S Newberry Way
- 1801 W Blaine Ave
- 1827 W Blaine Ave
- 1801 W Owyhee Ave
- 44 S Newberry Way
- 1819 W Owyhee Ave
- 1787 W Blaine Ave
- 1853 W Blaine Ave
- 1839 W Owyhee Ave
- 1890 W Blaine Ave
- 42 S Newberry Way
- 1765 W Blaine Ave
- 1879 W Blaine Ave
- 1859 W Owyhee Ave
- 40 S Newberry Way