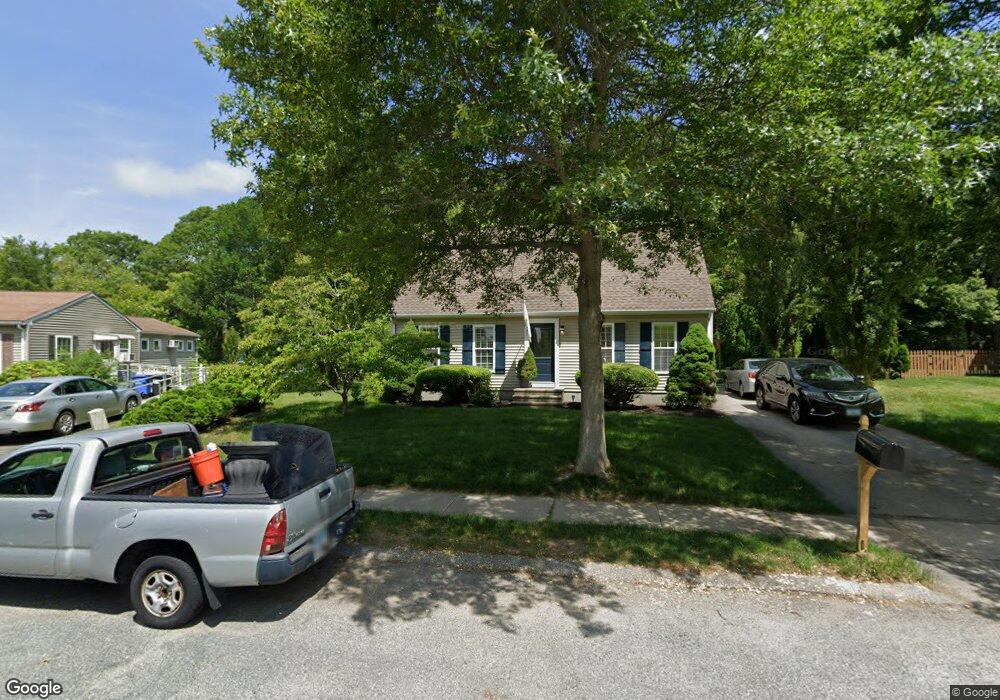
47 Sandy Bottom Shores Dr Wakefield, RI 02879
Estimated Value: $572,334 - $654,000
3
Beds
2
Baths
1,728
Sq Ft
$350/Sq Ft
Est. Value
About This Home
This home is located at 47 Sandy Bottom Shores Dr, Wakefield, RI 02879 and is currently estimated at $604,084, approximately $349 per square foot. 47 Sandy Bottom Shores Dr is a home located in Washington County with nearby schools including South Kingstown High School, Monsignor Matthew Clarke Catholic Regional School, and South Shore School.
Ownership History
Date
Name
Owned For
Owner Type
Purchase Details
Closed on
Oct 27, 1998
Sold by
Murray John A and Murphy Jennifer A
Bought by
Mcdavitt Timothy P and Henry Tara M
Current Estimated Value
Home Financials for this Owner
Home Financials are based on the most recent Mortgage that was taken out on this home.
Original Mortgage
$131,300
Interest Rate
6.74%
Purchase Details
Closed on
Mar 24, 1995
Sold by
Rocky Brook Re Co Llc
Bought by
Murphy John A and Murphy Jennifer
Create a Home Valuation Report for This Property
The Home Valuation Report is an in-depth analysis detailing your home's value as well as a comparison with similar homes in the area
Home Values in the Area
Average Home Value in this Area
Purchase History
| Date | Buyer | Sale Price | Title Company |
|---|---|---|---|
| Mcdavitt Timothy P | $138,500 | -- | |
| Murphy John A | $113,500 | -- |
Source: Public Records
Mortgage History
| Date | Status | Borrower | Loan Amount |
|---|---|---|---|
| Open | Murphy John A | $30,000 | |
| Open | Murphy John A | $141,000 | |
| Closed | Murphy John A | $13,400 | |
| Closed | Murphy John A | $131,300 |
Source: Public Records
Tax History
| Year | Tax Paid | Tax Assessment Tax Assessment Total Assessment is a certain percentage of the fair market value that is determined by local assessors to be the total taxable value of land and additions on the property. | Land | Improvement |
|---|---|---|---|---|
| 2025 | $4,736 | $529,800 | $217,500 | $312,300 |
| 2024 | $4,620 | $418,100 | $161,100 | $257,000 |
| 2023 | $4,620 | $418,100 | $161,100 | $257,000 |
| 2022 | $4,578 | $418,100 | $161,100 | $257,000 |
| 2021 | $4,451 | $308,000 | $123,800 | $184,200 |
| 2020 | $4,440 | $307,300 | $123,800 | $183,500 |
| 2019 | $4,440 | $307,300 | $123,800 | $183,500 |
| 2018 | $4,198 | $267,700 | $118,500 | $149,200 |
| 2017 | $4,098 | $267,700 | $118,500 | $149,200 |
| 2016 | $4,040 | $267,700 | $118,500 | $149,200 |
| 2015 | $3,899 | $251,200 | $107,700 | $143,500 |
| 2014 | $3,889 | $251,200 | $107,700 | $143,500 |
Source: Public Records
Map
Nearby Homes
- 128 Rodman St
- 260 Sweet Allen Farm Rd Unit 3
- 53 Rocky Brook Way
- 170 Weathervane Rd
- 48 Stone Bridge Dr
- 23 Rockland Dr
- 39 Secluded Dr
- 58 Vespia Ln
- 50 Vespia Ln
- 44 Vespia Ln
- 3 Larkin St
- 0 Vespia Dr Unit 1317499
- 56 Vespia Ln
- 534 Curtis Corner Rd
- 507 Curtis Corner Rd
- 1808 Kingstown Rd
- 35 Abbey Rd
- 35 Whittier Dr
- 37 Whittier Dr
- 918 Saugatucket Rd
- 39 Sandy Bottom Shores Dr
- 55 Sandy Bottom Shores Dr
- 0 Sandy Bottom Shores Dr
- 0 Sandy Bottom Shores Dr
- 0 Sandy Bottom Shores Dr
- 0 Sandy Bottom Shores Dr
- 31 Sandy Bottom Shores Dr
- 36 Sandy Bottom Shores Dr
- 66 Sandy Bottom Shores Dr
- 44 Sandy Bottom Shores Dr
- 21 Sandy Bottom Shores Dr
- 34 Celestial Heights Dr
- 13 Sandy Bottom Shores Dr
- 72 Sandy Bottom Shores Dr
- 117 George Schaeffer St
- 20 Celestial Heights Dr
- 33 Celestial Heights Dr
- 20 Sandy Bottom Shores Dr
- 5 Sandy Bottom Shores Dr
- 75 Sandy Bottom Shores Dr