47 Sandy Bottom Shores Dr Wakefield, RI 02879
Estimated Value: $582,000 - $643,000
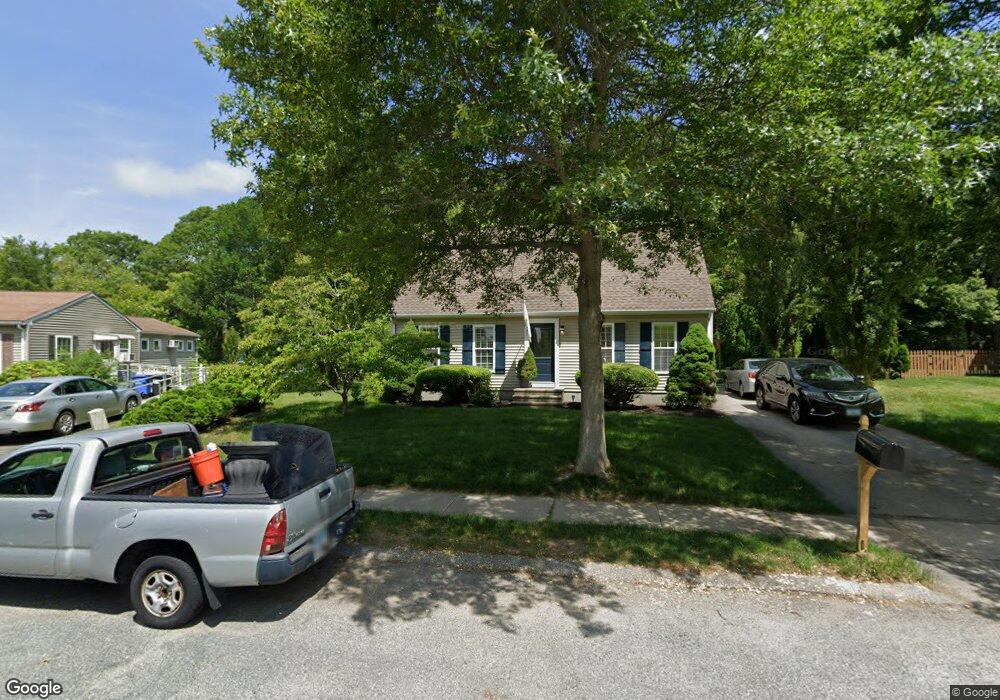
About This Home
This home is located at 47 Sandy Bottom Shores Dr, Wakefield, RI 02879 and is currently estimated at $616,922, approximately $357 per square foot. 47 Sandy Bottom Shores Dr is a home located in Washington County with nearby schools including South Kingstown High School, Monsignor Matthew Clarke Catholic Regional School, and South Shore School.
Ownership History
We collect this data history from publicly available records. To have your information removed, we recommend requesting removal directly through your county’s website.
Purchase Details
Home Financials for this Owner
Home Financials are based on the most recent Mortgage that was taken out on this home.Purchase Details
Home Values in the Area
Average Home Value in this Area
Purchase History
We collect this data history from publicly available records. To have your information removed, we recommend requesting removal directly through your county’s website.
| Date | Buyer | Sale Price | Title Company |
|---|---|---|---|
| $138,500 | -- | ||
| $113,500 | -- |
Mortgage History
We collect this data history from publicly available records. To have your information removed, we recommend requesting removal directly through your county’s website.
| Date | Status | Borrower | Loan Amount |
|---|---|---|---|
| Open | $30,000 | ||
| Open | $141,000 | ||
| Closed | $13,400 | ||
| Closed | $131,300 |
Tax History
We collect this data history from publicly available records. To have your information removed, we recommend requesting removal directly through your county’s website.
| Year | Tax Paid | Tax Assessment Tax Assessment Total Assessment is a certain percentage of the fair market value that is determined by local assessors to be the total taxable value of land and additions on the property. | Land | Improvement |
|---|---|---|---|---|
| 2025 | $4,736 | $529,800 | $217,500 | $312,300 |
| 2024 | $4,620 | $418,100 | $161,100 | $257,000 |
| 2023 | $4,620 | $418,100 | $161,100 | $257,000 |
| 2022 | $4,578 | $418,100 | $161,100 | $257,000 |
| 2021 | $4,451 | $308,000 | $123,800 | $184,200 |
| 2020 | $4,440 | $307,300 | $123,800 | $183,500 |
| 2019 | $4,440 | $307,300 | $123,800 | $183,500 |
| 2018 | $4,198 | $267,700 | $118,500 | $149,200 |
| 2017 | $4,098 | $267,700 | $118,500 | $149,200 |
| 2016 | $4,040 | $267,700 | $118,500 | $149,200 |
| 2015 | $3,899 | $251,200 | $107,700 | $143,500 |
| 2014 | $3,889 | $251,200 | $107,700 | $143,500 |
Map
- 25 Dinonsie Way
- 260 Sweet Allen Farm Rd Unit 3
- 260 Sweet Allen Farm Rd Unit 6
- 8 Susan Cir
- 435 Allen Ave
- 1676 Kingstown Rd
- 272 Pine Hill Rd
- 230 Curtis Corner Rd
- 104 Peaked Rock Rd
- 32 Paddy Hill Rd
- 23 Rockland Dr
- 1735 Kingstown Rd
- 54 Vespia Ln
- 42 Vespia Ln
- 106 North Rd
- 102 Woodbine Rd
- 35 N Woods Trail
- 978 Kingstown Rd
- 74 Oakwoods Dr
- 685 Curtis Corner Rd
- 39 Sandy Bottom Shores Dr
- 55 Sandy Bottom Shores Dr
- 0 Sandy Bottom Shores Dr
- 0 Sandy Bottom Shores Dr
- 0 Sandy Bottom Shores Dr
- 0 Sandy Bottom Shores Dr
- 31 Sandy Bottom Shores Dr
- 36 Sandy Bottom Shores Dr
- 66 Sandy Bottom Shores Dr
- 44 Sandy Bottom Shores Dr
- 21 Sandy Bottom Shores Dr
- 34 Celestial Heights Dr
- 13 Sandy Bottom Shores Dr
- 72 Sandy Bottom Shores Dr
- 117 George Schaeffer St
- 20 Celestial Heights Dr
- 33 Celestial Heights Dr
- 20 Sandy Bottom Shores Dr
- 5 Sandy Bottom Shores Dr
- 75 Sandy Bottom Shores Dr
Ask me questions while you tour the home.