47 Smith Rd Mansfield, MA 02048
Estimated Value: $977,000 - $1,165,000
6
Beds
5
Baths
3,882
Sq Ft
$277/Sq Ft
Est. Value
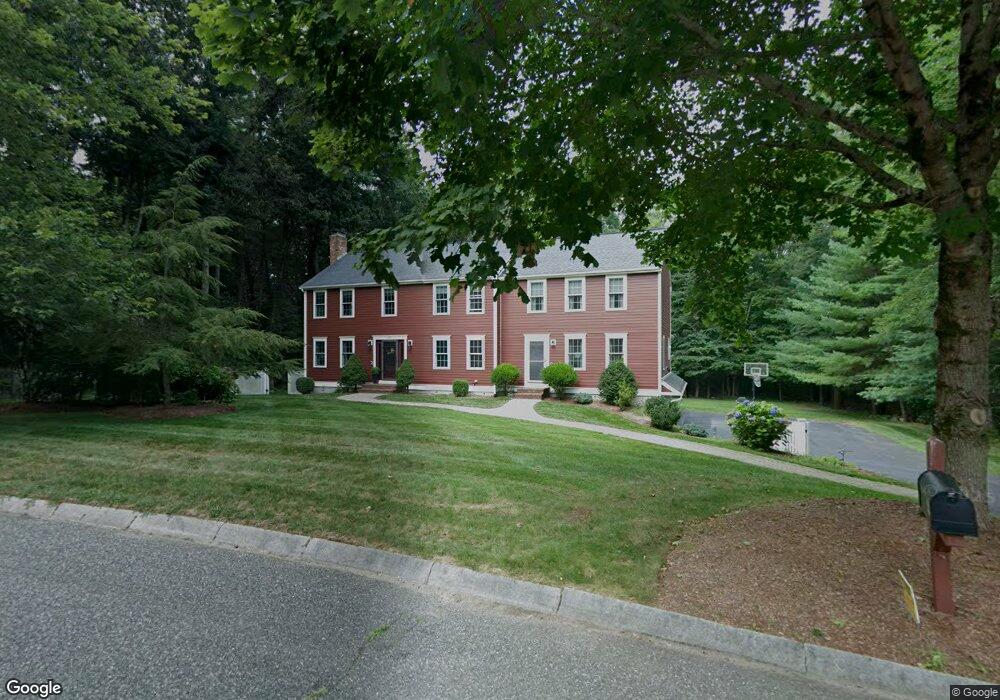
About This Home
This home is located at 47 Smith Rd, Mansfield, MA 02048 and is currently estimated at $1,076,053, approximately $277 per square foot. 47 Smith Rd is a home located in Bristol County with nearby schools including Everett W. Robinson Elementary School, Jordan/Jackson Elementary School, and Harold L. Qualters Middle School.
Ownership History
Date
Name
Owned For
Owner Type
Purchase Details
Closed on
Jun 26, 1997
Sold by
Christian & Feck Dev
Bought by
Johnson Paul H and Johnson Martha J
Current Estimated Value
Home Financials for this Owner
Home Financials are based on the most recent Mortgage that was taken out on this home.
Original Mortgage
$300,000
Interest Rate
7.81%
Mortgage Type
Purchase Money Mortgage
Purchase Details
Closed on
Mar 18, 1997
Sold by
Dejonco Constr Corp
Bought by
Christian & Feck Dev
Create a Home Valuation Report for This Property
The Home Valuation Report is an in-depth analysis detailing your home's value as well as a comparison with similar homes in the area
Home Values in the Area
Average Home Value in this Area
Purchase History
| Date | Buyer | Sale Price | Title Company |
|---|---|---|---|
| Johnson Paul H | $285,950 | -- | |
| Christian & Feck Dev | $85,000 | -- |
Source: Public Records
Mortgage History
| Date | Status | Borrower | Loan Amount |
|---|---|---|---|
| Previous Owner | Christian & Feck Dev | $314,000 | |
| Previous Owner | Christian & Feck Dev | $75,000 | |
| Previous Owner | Christian & Feck Dev | $300,000 |
Source: Public Records
Tax History
| Year | Tax Paid | Tax Assessment Tax Assessment Total Assessment is a certain percentage of the fair market value that is determined by local assessors to be the total taxable value of land and additions on the property. | Land | Improvement |
|---|---|---|---|---|
| 2025 | $11,831 | $898,300 | $279,100 | $619,200 |
| 2024 | $11,763 | $871,300 | $291,200 | $580,100 |
| 2023 | $11,249 | $798,400 | $291,200 | $507,200 |
| 2022 | $10,769 | $709,900 | $269,600 | $440,300 |
| 2021 | $10,609 | $690,700 | $224,800 | $465,900 |
| 2020 | $10,422 | $678,500 | $224,800 | $453,700 |
| 2019 | $9,971 | $655,100 | $187,200 | $467,900 |
| 2018 | $3,388 | $638,100 | $178,500 | $459,600 |
| 2017 | $9,321 | $620,600 | $173,500 | $447,100 |
| 2016 | $8,922 | $579,000 | $165,100 | $413,900 |
| 2015 | $8,654 | $558,300 | $165,100 | $393,200 |
Source: Public Records
Map
Nearby Homes
- 128 Tremont St
- 1769 West St
- 17 Childs Ln
- 24 Maverick Dr
- 25 Shepherd St
- 14 Claire Ave
- 401 South St
- 150 Gilbert St
- 346 South St
- 40 Treasure Island Rd
- 166 Chauncy St
- 16 Treasure Island Rd
- 9 Coach Rd
- 84 Messenger St
- 356 Central St
- 33 Colonial Way
- 150 Rumford Ave Unit 110
- 25 Munroe Dr
- 2 Oak St Unit 2B
- 28 Court St
Your Personal Tour Guide
Ask me questions while you tour the home.