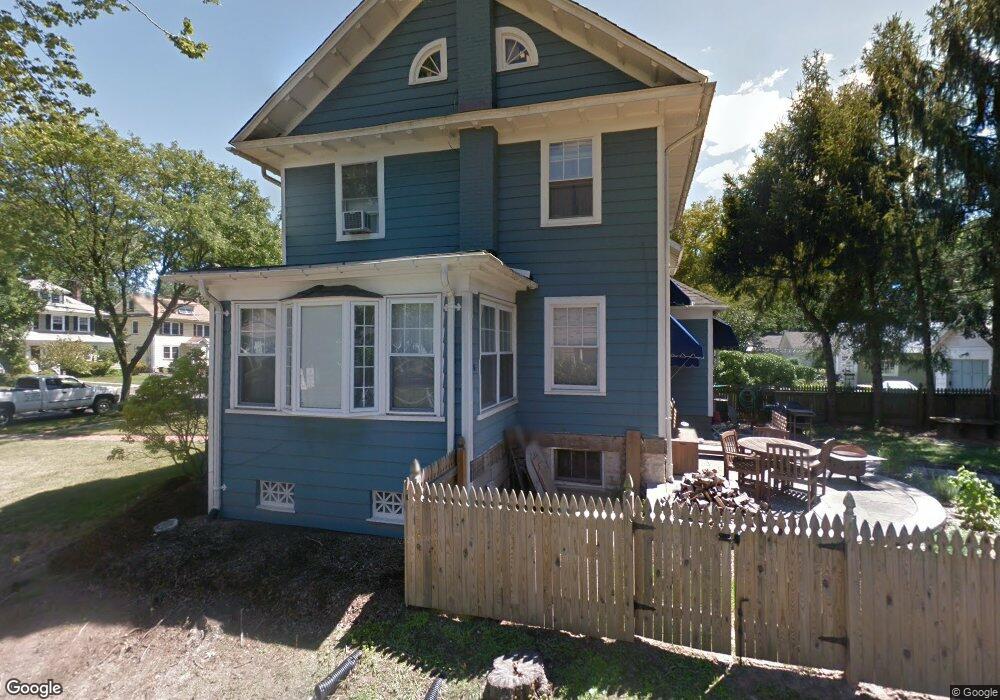
47 Spruce St Cranford, NJ 07016
Estimated Value: $640,488 - $938,000
Studio
--
Bath
1,847
Sq Ft
$443/Sq Ft
Est. Value
About This Home
This home is located at 47 Spruce St, Cranford, NJ 07016 and is currently estimated at $818,872, approximately $443 per square foot. 47 Spruce St is a home located in Union County with nearby schools including Cranford Sr High School, St Michael School, and Christopher Academy Montessori.
Ownership History
Date
Name
Owned For
Owner Type
Purchase Details
Closed on
Jul 22, 2004
Sold by
Bottino Peter
Bought by
Valerio Thomas and Valerio Joan
Current Estimated Value
Home Financials for this Owner
Home Financials are based on the most recent Mortgage that was taken out on this home.
Original Mortgage
$329,500
Outstanding Balance
$165,796
Interest Rate
6.33%
Estimated Equity
$653,076
Purchase Details
Closed on
Jun 18, 2001
Sold by
Okeefe Robert W and Okeefe Kelli A
Bought by
Bottino Peter A
Home Financials for this Owner
Home Financials are based on the most recent Mortgage that was taken out on this home.
Original Mortgage
$272,000
Interest Rate
7.09%
Create a Home Valuation Report for This Property
The Home Valuation Report is an in-depth analysis detailing your home's value as well as a comparison with similar homes in the area
Home Values in the Area
Average Home Value in this Area
Purchase History
| Date | Buyer | Sale Price | Title Company |
|---|---|---|---|
| Valerio Thomas | $457,500 | -- | |
| Bottino Peter A | $340,000 | -- |
Source: Public Records
Mortgage History
| Date | Status | Borrower | Loan Amount |
|---|---|---|---|
| Open | Valerio Thomas | $329,500 | |
| Previous Owner | Bottino Peter A | $272,000 |
Source: Public Records
Tax History
| Year | Tax Paid | Tax Assessment Tax Assessment Total Assessment is a certain percentage of the fair market value that is determined by local assessors to be the total taxable value of land and additions on the property. | Land | Improvement |
|---|---|---|---|---|
| 2025 | $11,863 | $175,000 | $87,100 | $87,900 |
| 2024 | $11,667 | $175,000 | $87,100 | $87,900 |
| 2023 | $11,667 | $175,000 | $87,100 | $87,900 |
| 2022 | $11,571 | $175,000 | $87,100 | $87,900 |
| 2021 | $11,520 | $175,000 | $87,100 | $87,900 |
| 2020 | $11,484 | $175,000 | $87,100 | $87,900 |
| 2019 | $11,410 | $175,000 | $87,100 | $87,900 |
| 2018 | $11,204 | $175,000 | $87,100 | $87,900 |
| 2017 | $10,819 | $175,000 | $87,100 | $87,900 |
| 2016 | $10,425 | $175,000 | $87,100 | $87,900 |
| 2015 | $10,152 | $175,000 | $87,100 | $87,900 |
| 2014 | $9,944 | $167,500 | $87,100 | $80,400 |
Source: Public Records
Map
Nearby Homes
- 21 Spruce St
- 19 Berkeley Place
- 28 Hampton Rd
- 684 Gallows Hill Rd
- 308 Edgar Ave
- 8 Venetia Ave
- 401 Brookside Place
- 18 Springfield Ave Unit 3A
- 201 Maple Place
- 116 Willow Ave
- 484 4th Ave Unit 9
- 40 Johnson Ave
- 21 Sandra Cir
- 34 Columbia Ave
- 113 Columbia Ave
- 37 A3 Sandra Cir
- 37C3 Sandra Cir Unit 3
- 33 Park Dr
- 46 B Sandra Cir Unit 4
- 103 High St
Your Personal Tour Guide
Ask me questions while you tour the home.