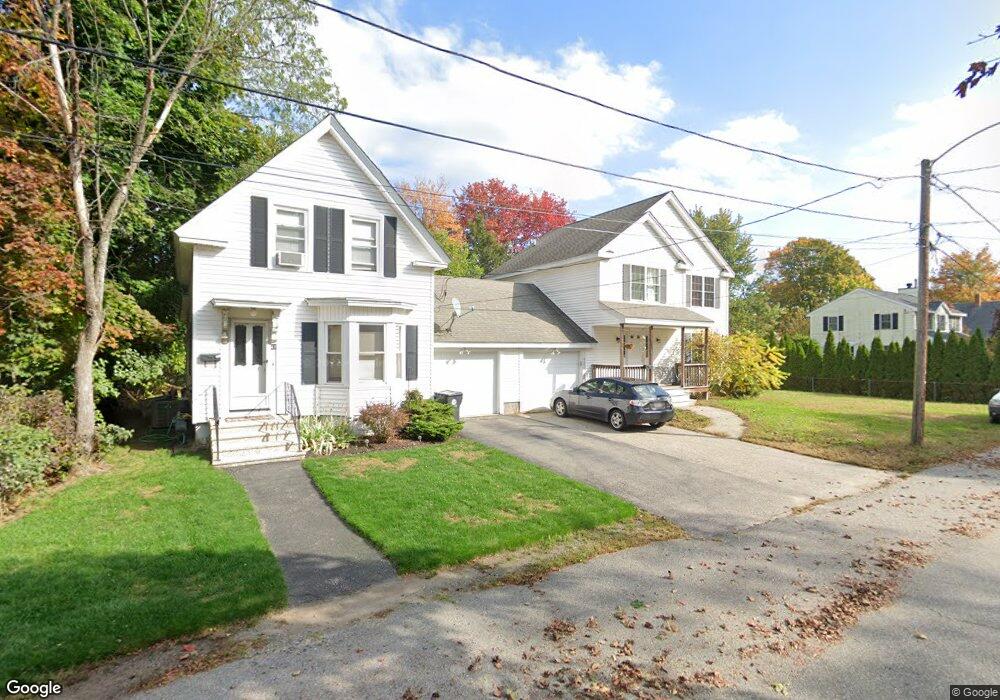
47 Spruce St Haverhill, MA 01830
Riverside NeighborhoodEstimated Value: $389,000 - $417,000
2
Beds
1
Bath
1,300
Sq Ft
$307/Sq Ft
Est. Value
About This Home
This home is located at 47 Spruce St, Haverhill, MA 01830 and is currently estimated at $399,488, approximately $307 per square foot. 47 Spruce St is a home located in Essex County with nearby schools including Golden Hill, Dr. Paul Nettle Middle School, and Haverhill High School.
Ownership History
Date
Name
Owned For
Owner Type
Purchase Details
Closed on
Oct 30, 2020
Sold by
Shipley John R
Bought by
Decker A Patterson T
Current Estimated Value
Purchase Details
Closed on
Sep 1, 2005
Sold by
Daniels Homes Llc
Bought by
Shipley John R
Home Financials for this Owner
Home Financials are based on the most recent Mortgage that was taken out on this home.
Original Mortgage
$191,000
Interest Rate
5.81%
Mortgage Type
Purchase Money Mortgage
Purchase Details
Closed on
Mar 16, 2005
Sold by
Miliner Claudia M and Berry Edward
Bought by
Daniels Homes Llc
Home Financials for this Owner
Home Financials are based on the most recent Mortgage that was taken out on this home.
Original Mortgage
$350,000
Interest Rate
5.64%
Mortgage Type
Purchase Money Mortgage
Create a Home Valuation Report for This Property
The Home Valuation Report is an in-depth analysis detailing your home's value as well as a comparison with similar homes in the area
Home Values in the Area
Average Home Value in this Area
Purchase History
| Date | Buyer | Sale Price | Title Company |
|---|---|---|---|
| Decker A Patterson T | $273,000 | None Available | |
| Shipley John R | $239,000 | -- | |
| Daniels Homes Llc | $230,000 | -- |
Source: Public Records
Mortgage History
| Date | Status | Borrower | Loan Amount |
|---|---|---|---|
| Previous Owner | Daniels Homes Llc | $203,707 | |
| Previous Owner | Daniels Homes Llc | $191,000 | |
| Previous Owner | Daniels Homes Llc | $350,000 |
Source: Public Records
Tax History Compared to Growth
Tax History
| Year | Tax Paid | Tax Assessment Tax Assessment Total Assessment is a certain percentage of the fair market value that is determined by local assessors to be the total taxable value of land and additions on the property. | Land | Improvement |
|---|---|---|---|---|
| 2025 | $3,312 | $309,200 | $0 | $309,200 |
| 2024 | $3,126 | $293,800 | $0 | $293,800 |
| 2023 | $2,975 | $266,800 | $0 | $266,800 |
| 2022 | $2,814 | $221,200 | $0 | $221,200 |
| 2021 | $2,628 | $195,500 | $0 | $195,500 |
| 2020 | $2,569 | $188,900 | $0 | $188,900 |
| 2019 | $2,452 | $175,800 | $0 | $175,800 |
| 2018 | $2,126 | $169,300 | $0 | $169,300 |
| 2017 | $2,126 | $141,800 | $0 | $141,800 |
| 2016 | $2,178 | $141,800 | $0 | $141,800 |
| 2015 | $2,177 | $141,800 | $0 | $141,800 |
Source: Public Records
Map
Nearby Homes
- 104 Keeley St Unit A
- 63 Old Ferry Rd
- 49 Douglas St
- 65 Madison St Unit 65
- 54 Lincoln Ave
- 23 Orchard Ave Unit E
- 144 Old Ferry Rd Unit H
- 19 Orchard Ave Unit F
- 29 Claremont Ave
- 121 Linwood St
- 28 Coffin Ave
- 420 Water St
- 358 Main St
- 47 Gardner St
- 280 E Broadway
- 1 Lisa Ln
- 404 Main St
- 366 Kenoza St
- 425 Main St
- 33 Groveland Commons Way