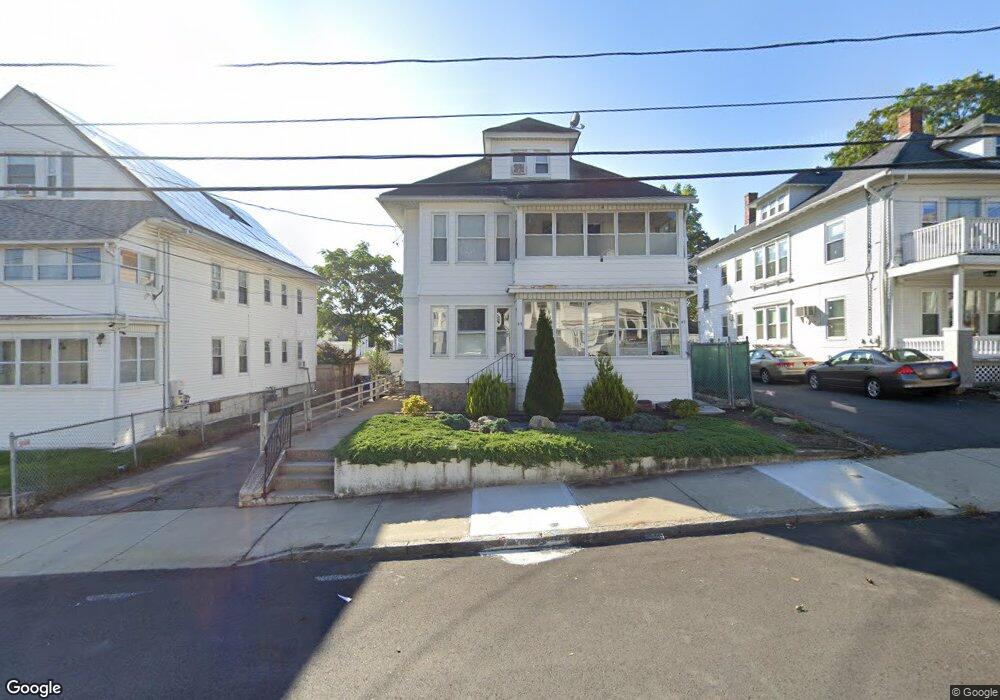
47 Swan St Unit 49 Lawrence, MA 01841
Prospect Hill-Back Bay NeighborhoodEstimated Value: $690,849 - $948,000
5
Beds
2
Baths
3,105
Sq Ft
$253/Sq Ft
Est. Value
About This Home
This home is located at 47 Swan St Unit 49, Lawrence, MA 01841 and is currently estimated at $785,712, approximately $253 per square foot. 47 Swan St Unit 49 is a home located in Essex County with nearby schools including School For Exceptional Studies, Community Day Charter Public School - Gateway, and Esperanza Academy School of Hope.
Ownership History
Date
Name
Owned For
Owner Type
Purchase Details
Closed on
Sep 15, 2011
Sold by
Bank Of America Na
Bought by
Ramirez Joel
Current Estimated Value
Home Financials for this Owner
Home Financials are based on the most recent Mortgage that was taken out on this home.
Original Mortgage
$142,511
Outstanding Balance
$96,929
Interest Rate
4.5%
Mortgage Type
FHA
Estimated Equity
$688,783
Purchase Details
Closed on
Dec 2, 2009
Sold by
Chery Edna J and Bank Of America Na
Bought by
Bank Of America Na
Purchase Details
Closed on
Oct 23, 2007
Sold by
Paguandas Leon and Chery Edna J
Bought by
Chery Edna J
Purchase Details
Closed on
Aug 30, 2004
Sold by
Kibildis Adam C
Bought by
Paguandas Leon
Home Financials for this Owner
Home Financials are based on the most recent Mortgage that was taken out on this home.
Original Mortgage
$332,405
Interest Rate
6.02%
Mortgage Type
Purchase Money Mortgage
Purchase Details
Closed on
Aug 31, 2000
Sold by
Kibildis Thomas G
Bought by
Kibildis Adam C
Create a Home Valuation Report for This Property
The Home Valuation Report is an in-depth analysis detailing your home's value as well as a comparison with similar homes in the area
Home Values in the Area
Average Home Value in this Area
Purchase History
| Date | Buyer | Sale Price | Title Company |
|---|---|---|---|
| Ramirez Joel | $165,500 | -- | |
| Ramirez Joel | $165,500 | -- | |
| Bank Of America Na | $313,869 | -- | |
| Bank Of America Na | $313,869 | -- | |
| Chery Edna J | -- | -- | |
| Chery Edna J | -- | -- | |
| Paguandas Leon | $349,900 | -- | |
| Paguandas Leon | $349,900 | -- | |
| Kibildis Adam C | $150,000 | -- | |
| Kibildis Adam C | $150,000 | -- |
Source: Public Records
Mortgage History
| Date | Status | Borrower | Loan Amount |
|---|---|---|---|
| Open | Ramirez Joel | $142,511 | |
| Closed | Kibildis Adam C | $14,000 | |
| Closed | Kibildis Adam C | $142,511 | |
| Previous Owner | Paguandas Leon | $332,405 |
Source: Public Records
Tax History
| Year | Tax Paid | Tax Assessment Tax Assessment Total Assessment is a certain percentage of the fair market value that is determined by local assessors to be the total taxable value of land and additions on the property. | Land | Improvement |
|---|---|---|---|---|
| 2025 | $6,178 | $702,100 | $147,000 | $555,100 |
| 2024 | $5,663 | $612,200 | $108,700 | $503,500 |
| 2023 | $5,973 | $587,900 | $106,000 | $481,900 |
| 2022 | $5,691 | $497,500 | $106,000 | $391,500 |
| 2021 | $5,548 | $452,200 | $106,000 | $346,200 |
| 2020 | $5,460 | $439,300 | $95,300 | $344,000 |
| 2019 | $4,889 | $357,400 | $85,700 | $271,700 |
| 2018 | $4,471 | $312,200 | $73,700 | $238,500 |
| 2017 | $4,258 | $277,600 | $72,800 | $204,800 |
| 2016 | $3,922 | $252,900 | $53,100 | $199,800 |
| 2015 | $3,623 | $239,600 | $53,100 | $186,500 |
Source: Public Records
Map
Nearby Homes
- 25-27 Bicknell Ave
- 129-131 Lexington St
- 5 Kendrick St
- 14 Court St
- 173 Jackson St
- 39 Swan Ave
- 97 Kenwood Rd
- 12 Annette St
- 7-9 Bennington St
- 131A Lawrence St Unit 40
- 192 Union St
- 434-438 Hampshire St
- 162 E Haverhill St
- 37 Albion St
- 65 Arthur St
- 18 Erhardt Terrace
- 7 Erhardt Terrace
- 27 Willow St Unit A
- 106 Leroy Ave
- 29 Center St
- 45 Swan St
- 51 Swan St Unit 51A
- 39 - 41 Swan St
- 39 Swan St Unit 41
- 32 Swan St Unit 34
- 36-38 Swan St
- 53-55 Swan St
- 36 Swan St Unit 38
- 53 Swan St Unit 55
- 32-34 Swan St
- 40 Swan St
- 44 Cornish St Unit 46
- 28 Swan St Unit 30
- 35 Swan St
- 4 Cornish Street Extension
- 24 Swan St Unit 26
- 24-26 Swan St
- 40 Cornish St Unit 42
- 30 Montgomery St Unit 32
- 28 Montgomery St
Your Personal Tour Guide
Ask me questions while you tour the home.