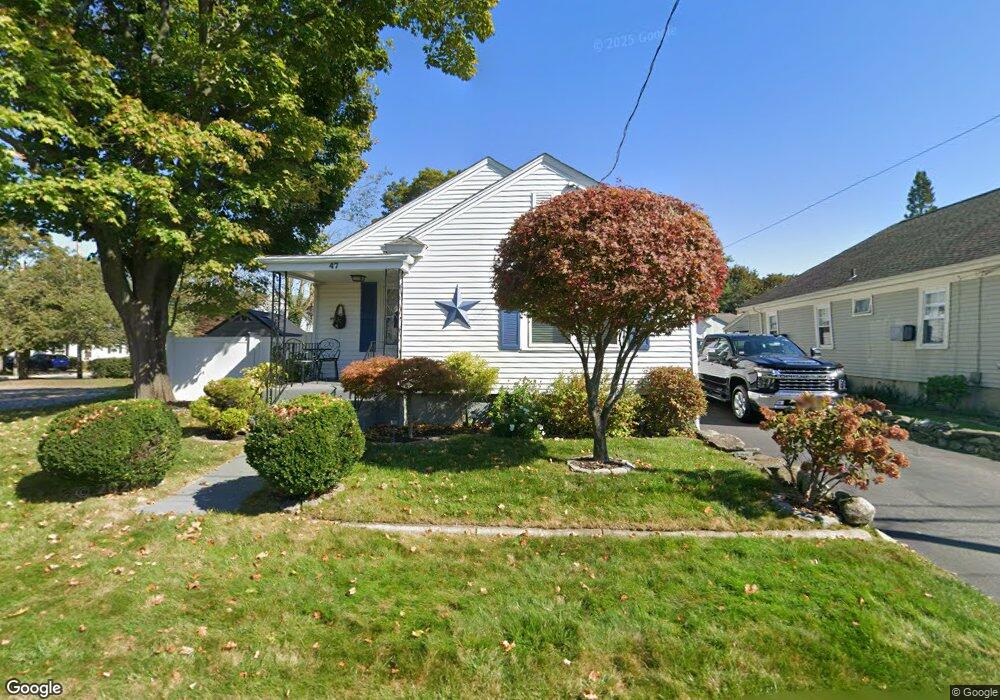
47 Thurber St Pawtucket, RI 02861
Darlington NeighborhoodEstimated Value: $390,415 - $442,000
3
Beds
2
Baths
1,751
Sq Ft
$234/Sq Ft
Est. Value
About This Home
This home is located at 47 Thurber St, Pawtucket, RI 02861 and is currently estimated at $410,354, approximately $234 per square foot. 47 Thurber St is a home located in Providence County with nearby schools including St Cecilia School and Dayspring Christian Academy.
Ownership History
Date
Name
Owned For
Owner Type
Purchase Details
Closed on
May 3, 2016
Sold by
Metcalf Nancy A
Bought by
Metcalf Richard A
Current Estimated Value
Purchase Details
Closed on
Sep 17, 2014
Sold by
Metcalf Richard A
Bought by
Metcalf Richard A and Metcalf Nancy A
Purchase Details
Closed on
Apr 26, 2010
Sold by
Wilbur Joan Iris and Wilbur Gharlotte
Bought by
Metcalf Richard A
Home Financials for this Owner
Home Financials are based on the most recent Mortgage that was taken out on this home.
Original Mortgage
$166,920
Interest Rate
5%
Mortgage Type
Purchase Money Mortgage
Create a Home Valuation Report for This Property
The Home Valuation Report is an in-depth analysis detailing your home's value as well as a comparison with similar homes in the area
Home Values in the Area
Average Home Value in this Area
Purchase History
| Date | Buyer | Sale Price | Title Company |
|---|---|---|---|
| Metcalf Richard A | -- | -- | |
| Metcalf Richard A | -- | -- | |
| Metcalf Richard A | $170,000 | -- |
Source: Public Records
Mortgage History
| Date | Status | Borrower | Loan Amount |
|---|---|---|---|
| Previous Owner | Metcalf Richard A | $166,920 | |
| Previous Owner | Metcalf Richard A | $60,000 |
Source: Public Records
Tax History Compared to Growth
Tax History
| Year | Tax Paid | Tax Assessment Tax Assessment Total Assessment is a certain percentage of the fair market value that is determined by local assessors to be the total taxable value of land and additions on the property. | Land | Improvement |
|---|---|---|---|---|
| 2025 | $4,128 | $313,900 | $145,600 | $168,300 |
| 2024 | $3,874 | $313,900 | $145,600 | $168,300 |
| 2023 | $3,859 | $227,800 | $89,000 | $138,800 |
| 2022 | $3,777 | $227,800 | $89,000 | $138,800 |
| 2021 | $3,777 | $227,800 | $89,000 | $138,800 |
| 2020 | $3,923 | $187,800 | $77,500 | $110,300 |
| 2019 | $3,923 | $187,800 | $77,500 | $110,300 |
| 2018 | $3,780 | $187,800 | $77,500 | $110,300 |
| 2017 | $3,712 | $163,400 | $70,200 | $93,200 |
| 2016 | $3,577 | $163,400 | $70,200 | $93,200 |
| 2015 | $3,577 | $163,400 | $70,200 | $93,200 |
| 2014 | $3,210 | $139,200 | $58,500 | $80,700 |
Source: Public Records
Map
Nearby Homes
- 15 Don Ct
- 888 Central Ave
- 26 Blackburn St
- 103 Clews St
- 496 Daggett Ave
- 77 Pinecrest Dr
- 38 Madison St
- 102 Ames St
- 70 Archer St
- 342 Grand Ave
- 41 Calder St
- 35 Cushman St
- 228 London Ave
- 105 Metropolitan Park Ave
- 76 Case Ave Unit 76
- 139 Suffolk Ave
- 126 Suffolk Ave
- 210 Pinecrest Dr
- 0 Perrin Ave
- 99 Roosevelt St