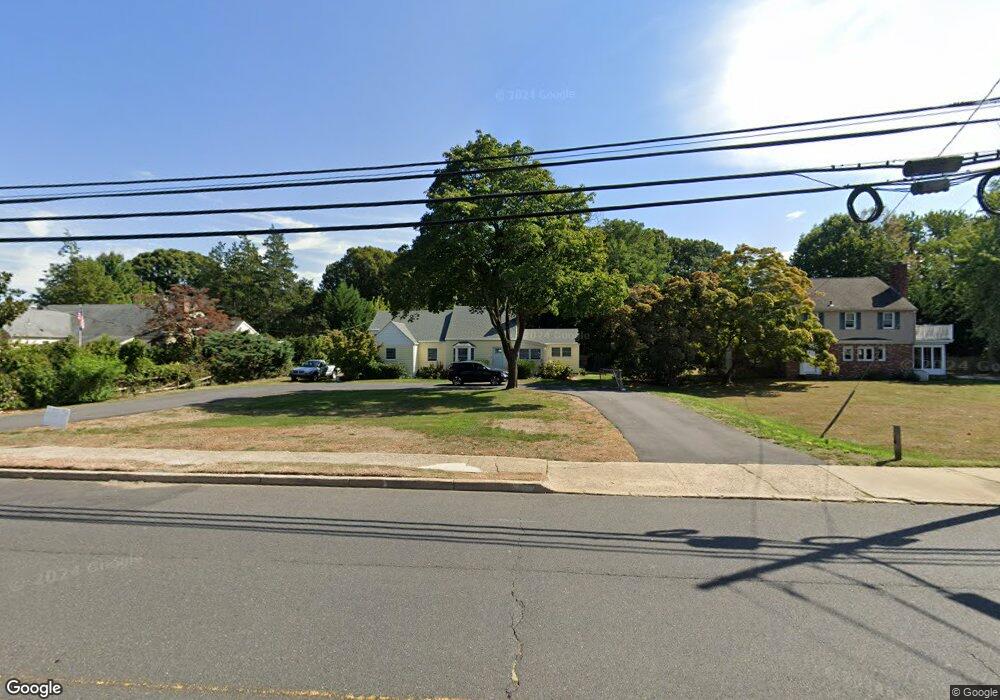
47 Tindall Rd Middletown, NJ 07748
New Monmouth NeighborhoodEstimated Value: $696,000 - $825,419
3
Beds
2
Baths
2,216
Sq Ft
$348/Sq Ft
Est. Value
About This Home
This home is located at 47 Tindall Rd, Middletown, NJ 07748 and is currently estimated at $770,855, approximately $347 per square foot. 47 Tindall Rd is a home located in Monmouth County with nearby schools including Bayview Elementary School, Thorne Middle School, and Middletown High School North.
Ownership History
Date
Name
Owned For
Owner Type
Purchase Details
Closed on
Aug 3, 2009
Sold by
47 Tindall Llc
Bought by
Hirschbein Erik and Vancleve Tiffany
Current Estimated Value
Home Financials for this Owner
Home Financials are based on the most recent Mortgage that was taken out on this home.
Original Mortgage
$289,580
Outstanding Balance
$188,808
Interest Rate
5.21%
Mortgage Type
FHA
Estimated Equity
$582,047
Purchase Details
Closed on
May 23, 2007
Sold by
Gelberg David and Hecht Gelberg Doris
Bought by
Hecht Gelberg Doris
Purchase Details
Closed on
Mar 5, 2002
Sold by
Wallace Henry
Bought by
Gelberg David and Gelberg Doris Hecht
Home Financials for this Owner
Home Financials are based on the most recent Mortgage that was taken out on this home.
Original Mortgage
$172,000
Interest Rate
7.18%
Create a Home Valuation Report for This Property
The Home Valuation Report is an in-depth analysis detailing your home's value as well as a comparison with similar homes in the area
Home Values in the Area
Average Home Value in this Area
Purchase History
| Date | Buyer | Sale Price | Title Company |
|---|---|---|---|
| Hirschbein Erik | $284,625 | First American Title Ins Co | |
| Hecht Gelberg Doris | -- | Multiple | |
| Gelberg David | $215,000 | -- |
Source: Public Records
Mortgage History
| Date | Status | Borrower | Loan Amount |
|---|---|---|---|
| Open | Hirschbein Erik | $289,580 | |
| Previous Owner | Gelberg David | $172,000 |
Source: Public Records
Tax History
| Year | Tax Paid | Tax Assessment Tax Assessment Total Assessment is a certain percentage of the fair market value that is determined by local assessors to be the total taxable value of land and additions on the property. | Land | Improvement |
|---|---|---|---|---|
| 2025 | $10,944 | $702,400 | $373,500 | $328,900 |
| 2024 | $9,017 | $665,300 | $342,500 | $322,800 |
| 2023 | $9,017 | $518,800 | $283,500 | $235,300 |
| 2022 | $7,549 | $461,300 | $237,200 | $224,100 |
| 2021 | $7,549 | $358,900 | $204,800 | $154,100 |
| 2020 | $7,085 | $331,400 | $197,600 | $133,800 |
| 2019 | $6,984 | $330,700 | $197,600 | $133,100 |
| 2018 | $6,943 | $320,400 | $189,000 | $131,400 |
| 2017 | $5,879 | $276,800 | $189,000 | $87,800 |
| 2016 | $6,020 | $282,500 | $189,000 | $93,500 |
| 2015 | $6,053 | $283,400 | $189,000 | $94,400 |
| 2014 | $6,026 | $275,300 | $189,000 | $86,300 |
Source: Public Records
Map
Nearby Homes
Your Personal Tour Guide
Ask me questions while you tour the home.