Estimated Value: $164,000 - $197,000
--
Bed
--
Bath
943
Sq Ft
$191/Sq Ft
Est. Value
About This Home
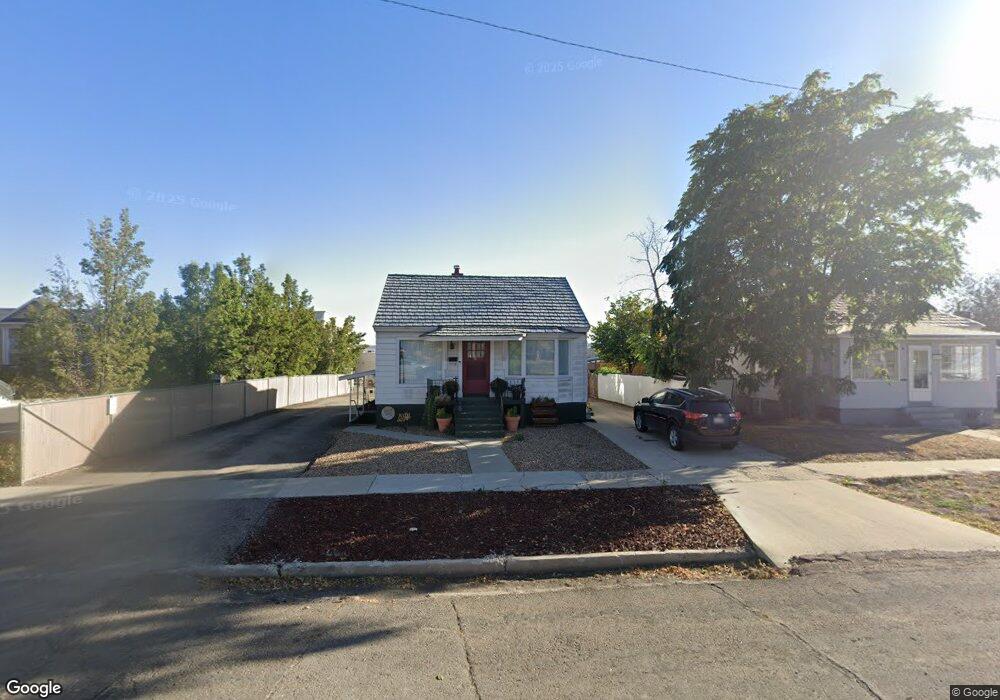
This home is located at 47 W 200 N, Price, UT 84501 and is currently estimated at $179,666, approximately $190 per square foot. 47 W 200 N is a home with nearby schools including Castle Heights School, Mont Harmon Junior High School, and Carbon High School.
Ownership History
Date
Name
Owned For
Owner Type
Purchase Details
Closed on
Sep 30, 2025
Sold by
Obrien David L and Obrien Shauna F
Bought by
Rmce Heirloom Alf Propco Llc
Current Estimated Value
Home Financials for this Owner
Home Financials are based on the most recent Mortgage that was taken out on this home.
Original Mortgage
$380,000
Outstanding Balance
$379,662
Interest Rate
6.58%
Mortgage Type
New Conventional
Estimated Equity
-$199,996
Purchase Details
Closed on
Aug 9, 2023
Sold by
Obrien Llc
Bought by
Obrien David L and Obrien Shauna F
Purchase Details
Closed on
Jul 30, 2009
Sold by
Jensen Marjorie L and Stowell Shannon
Bought by
Obrien Llc
Create a Home Valuation Report for This Property
The Home Valuation Report is an in-depth analysis detailing your home's value as well as a comparison with similar homes in the area
Home Values in the Area
Average Home Value in this Area
Purchase History
| Date | Buyer | Sale Price | Title Company |
|---|---|---|---|
| Rmce Heirloom Alf Propco Llc | -- | Cottonwood Title | |
| Obrien David L | -- | None Listed On Document | |
| Obrien Llc | -- | Professional Title Services |
Source: Public Records
Mortgage History
| Date | Status | Borrower | Loan Amount |
|---|---|---|---|
| Open | Rmce Heirloom Alf Propco Llc | $380,000 |
Source: Public Records
Tax History Compared to Growth
Tax History
| Year | Tax Paid | Tax Assessment Tax Assessment Total Assessment is a certain percentage of the fair market value that is determined by local assessors to be the total taxable value of land and additions on the property. | Land | Improvement |
|---|---|---|---|---|
| 2025 | $768 | $63,218 | $8,181 | $55,037 |
| 2024 | $896 | $74,631 | $9,488 | $65,143 |
| 2023 | $1,078 | $95,713 | $12,647 | $83,066 |
| 2022 | $1,120 | $162,267 | $19,117 | $143,150 |
| 2021 | $969 | $119,797 | $16,065 | $103,732 |
| 2020 | $945 | $58,621 | $0 | $0 |
| 2019 | $841 | $54,748 | $0 | $0 |
| 2018 | $692 | $45,943 | $0 | $0 |
| 2017 | $684 | $45,943 | $0 | $0 |
| 2016 | $617 | $45,943 | $0 | $0 |
| 2015 | $617 | $45,943 | $0 | $0 |
| 2014 | $613 | $45,943 | $0 | $0 |
| 2013 | $544 | $40,432 | $0 | $0 |
Source: Public Records
Map
Nearby Homes